Figures & data
Figure 1 The qualified individuals and their geographic distribution. (A) Flow chart shows the individuals meeting inclusion criteria. (B) The prevalence of TDR among ART-naïve HIV-1 infected individuals residing in Myanmar between 2008 and 2014. The triangle shadow indicates the well-known illicit drug-producing region “Golden Triangle”.
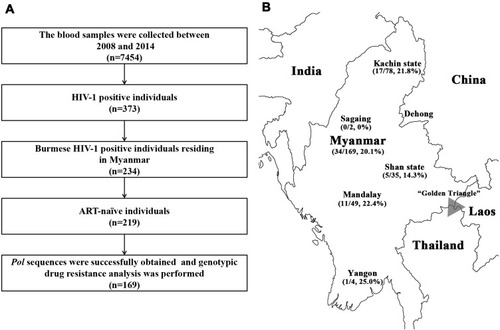
Table 1 Social-Demographic Characteristics of Study Subjects
Figure 2 Maximum likelihood tree based on the pol fragment among ART-naïve individuals in Myanmar. The red asterisk and spots indicate the drug-resistance mutation with clinical significance and other DRMs, respectively. Drug-resistance mutations with clinical significance lead to low levels and above drug resistance. Mutations associated with resistance to PI, NRTI and NNRTI are indicated with magenta, red and blue, respectively. The brackets indicate transmission clusters that were identified by Cluster Picker.
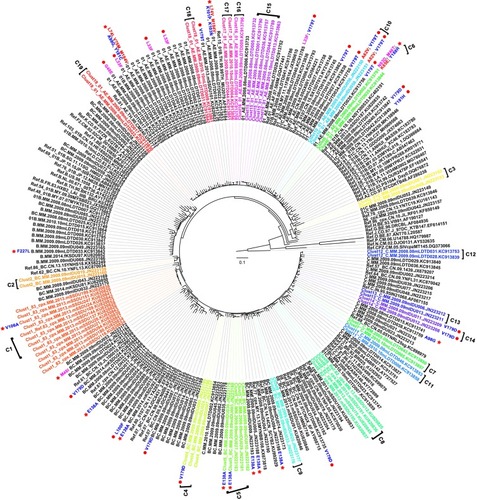
Figure 3 Characteristics of HIV-1 drug resistance among ART-naïve individuals in Myanmar, 2008–2014. (A) The number of drug-resistance mutation sequences in different subtypes. (B) The distribution of subtypes of drug-resistance mutations. (C) The level of resistance predicted by the Stanford HIV Drug Resistance Database.
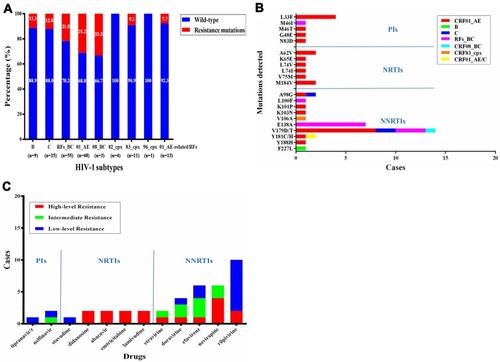
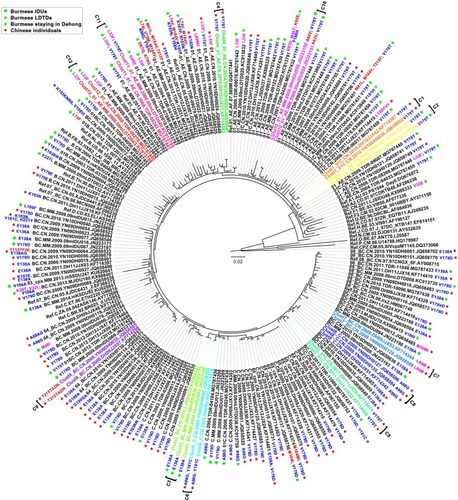
Figure 4 Maximum likelihood tree of the drug-resistance sequences among ART-naïve individuals in the China–Myanmar border region. The sequences from the Burmese IDUs,Citation28,Citation33,Citation34 Burmese LDTDs,Citation30 the Burmese staying in YunnanCitation29,Citation32 and newly diagnosed HIV-1 infections in Dehong, Yunnan provinceCitation37,Citation38 are highlighted by green spots, green triangles, green diamonds and red stars, respectively. Mutations associated with resistance to PI, NRTI and NNRTI are indicated with magenta, red and blue, respectively. The brackets indicate transmission clusters that were identified by Cluster Picker.