Figures & data
Table 1 Antibiotic Susceptibilities of A. towneri Strain AeBJ009
Table 2 Resistance Genes of A. towneri Strain AeBJ009
Figure 1 Circular maps of plasmid pNDM-AeBJ009. The outer circle contains the plasmid transfer and replication section (yellow arrows), type IV secretion system gene cluster section (blue arrows), and Tn125 section (red arrows). In addition, the known gene names reported in the NCBI database are marked below the corresponding arrows. The inner-circle indicates the positive and negative GC skew of the plasmid in green and purple, respectively.
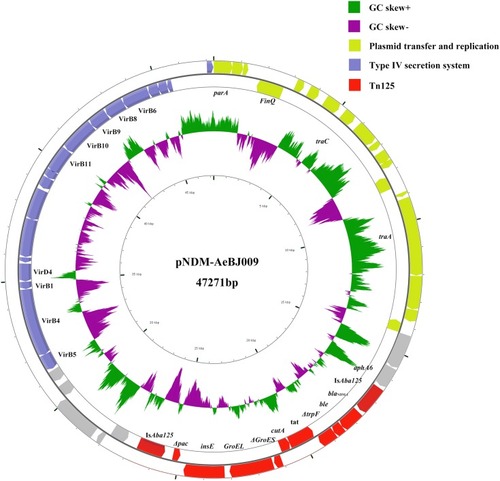
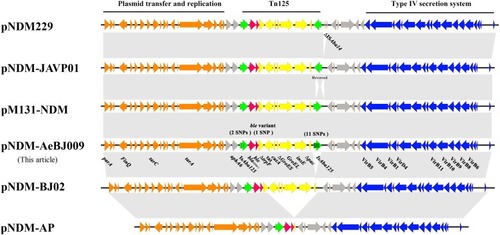
Figure 2 Comparative analysis of pNDM- AeBJ009 with other NDM-1-positive plasmids. The open reading frames are indicated by arrows. The blaNDM-1 gene and ble gene variant are shown in red. The insertion sequences ISAba125 are shown in green. The black vertical line indicates the SNP in genes. Other genes of the backbone are shown in orange, gray, yellow and blue, respectively. Homology regions among different plasmids are denoted by light gray.