Figures & data
Table 1 Primer Sequences and PCR Conditions Used in This Study
Table 2 Dilution Range and Susceptibility Breakpoints of Antimicrobial Agents Used in This Study
Table 3 Spa Type and Biofilm Production of the Staph. Aureus Isolates
Table 4 Minimum Inhibitory Concentrations (μg/mL) of the Staph. Aureus Isolates from the Milk of Dairy Cows with Mastitis (56 Isolates)
Figure 1 Boxplots of the in vitro biofilm production of Staph. aureus strains of the major spa types (n≥5). Each dot represents one strain. Biofilm production was different among the main spa types, especially spa types t730 and t1456, which produced less biofilm than the other main spa type. Significance was determined by an ANOVA test (* P<0.05; ** P<0.01).
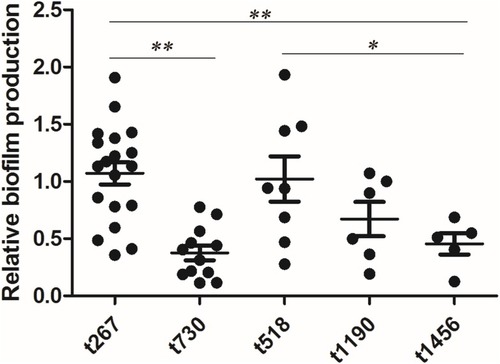
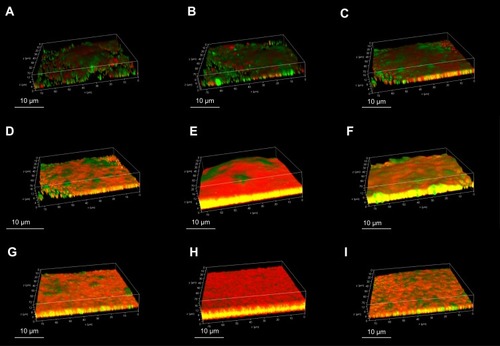
Figure 2 Confocal laser scanning microscopy of in vitro biofilm production of Staph. aureus isolates. The biofilms were stained with LIVE/DEAD stain. Green represents live cells, red represents dead cells and eDNA, and yellow represents a mixture. (A) SA0007; (B) SA0012; (C) SA0019; (D) SA0020; (E) SA0023; (F) SA0028; (G) SA0031; (H) SA0047; (I) SA0052.