Figures & data
Table 1 GenBbank Extracted Azurin Gene Sequences Analyzed in This Study
Table 2 Primer Sequences Used in This Study
Figure 1 The schematic representation of azurin gene and flanking regions. Position of primers for PCR amplification of azurin gene.
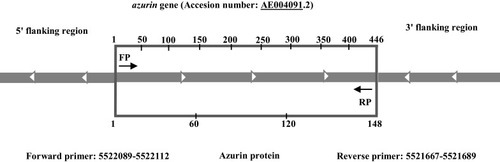
Table 3 Point Mutations Within the 446-Bp Segment of Azurin Gene in Iranian P. Aeruginosa Isolates in Relation to the Location of Isolation and Accession Numbers
Table 4 The Frequency of Amino Acid Substitutions Among Iranian Azurin Protein Sequences
Figure 2 PCR assay of azurin gene. Lanes 1–5: P. aeruginosa isolates, Lanes N and P: representatives of negative and positive controls. M: 100 bp DNA size marker.
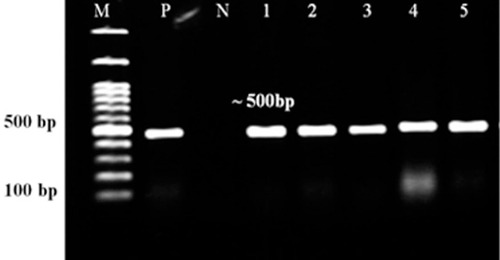
Figure 3 UPGMA dendrogram of P. aeruginosa clinical strains based on the difference in the nucleotides of azurin gene sequences. P. aeruginosa ATCC27853 and PAO1 were used as control. Each strain is presented based on the geographical region of its isolation, clinical sample, and gene expression fold change. T: Tehran, I: Isfahan.
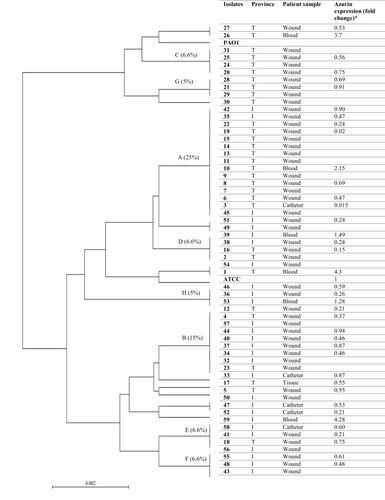
Figure 4 Circular dendrogram according to the global analysis of nucleotide polymorphism of azurin gene among P. aeruginosa strains. C and E next to the ID of the isolates determine the clinical and environmental sources of isolates. The geographical origin of the isolates is displayed using different colors.
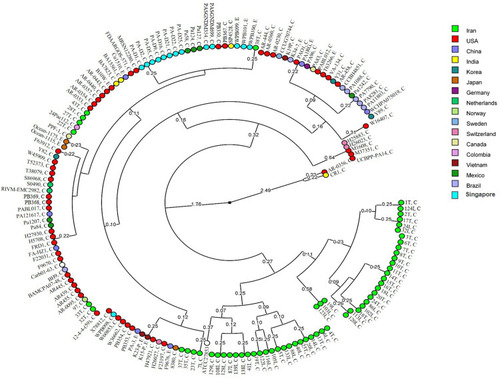
Figure 5 The multidimensional layout of global analysis of azurin gene in different isolates of P. aeruginosa according to UPGMA algorithms.
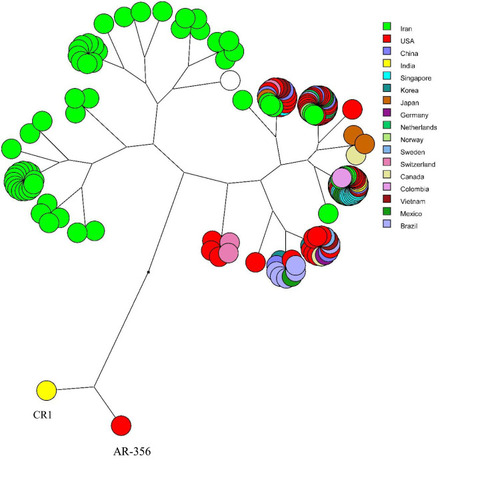
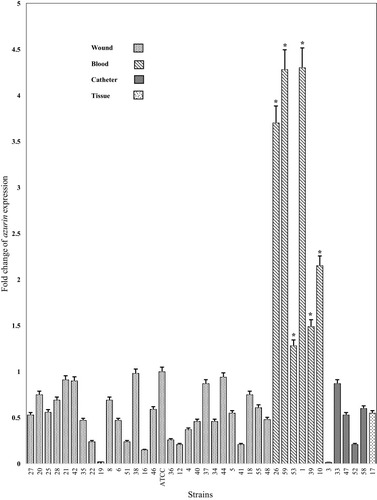
Figure 6 The fold change of azurin gene expression in different P. aeruginosa clinical strains isolated from different specimens (wound, blood, catheter, and tissue). *p< 0.001.