Figures & data
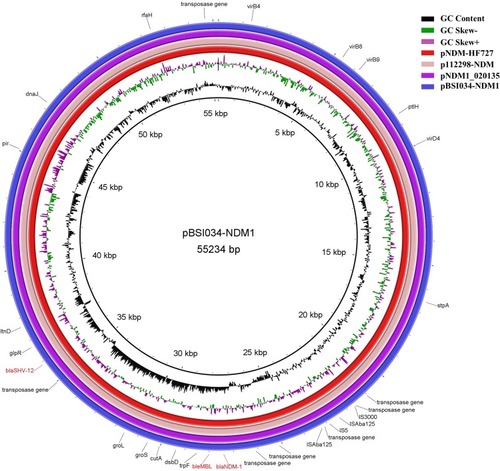
Figure 1 S1-PFGE and Southern blotting hybridization with the mcr-9 probe. The left image represents the S1-PFGE map of E. cloacae strains; the right image is the result of Southern blotting hybridization using mcr-9 probe.
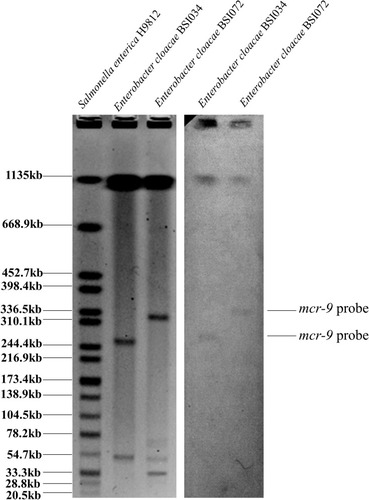
Figure 2 Schematic presentation of major structural features of pBSI034-MCR9 in comparison with five reference plasmids. Areas shaded in gray indicate homologous regions of ≥80% nucleotide sequence identity in the plasmid scaffold regions. ORFs are portrayed by arrows to indicate the direction of transcription and colored based on their predicted gene functions. The figure was drawn to scale.
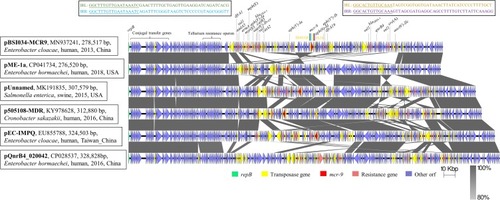
Figure 3 Circular genetic map of pBSI034-NDM1 and three reference plasmids. pNDM-HF727 (accession no. KF976405), p112298-NDM (accession no. KP987216), pNDM1_020135 (accession no. CP037965).