Figures & data
Figure 1 Changes in global TB incidence rate.
Notes: The green line represents the APCIR between 2015 and 2017; the red line represents the APCIR between 2015 and 2020 in the plan of the WHO End Tuberculosis Strategy; the blue line represents the required APCIR between 2018 and 2020 in order to reach the 2020 milestone of the WHO End Tuberculosis Strategy.
Abbreviations: APCIR, annual percentage change in the incidence rate.
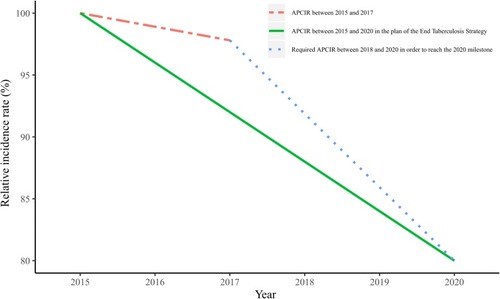
Table 1 The Incidence Rates in 2015, 2016 and 2017, The APCIR Between 2015 and 2017, and the Required APCIR Between 2018 and 2020 of Global and 21 Regions
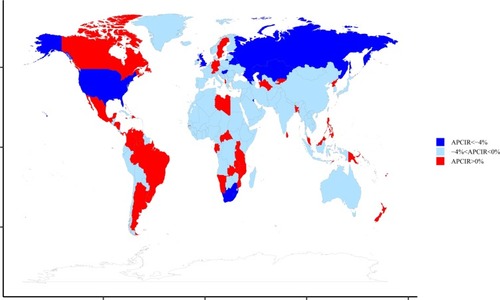
Figure 2 The APCIR of TB between 2015 and 2017 in 195 countries and territories.
Abbreviation: APCIR, annual percentage change in the incidence rate.