Figures & data
Figure 1 Procedure and results of mrCIM and reCIM. (A) Two 10-µL loopfuls of an overnight culture taken from solid media were homogenized into an Eppendorf tube containing 1mL of sterile water. (B) Two meropenem disks were added to the suspension and vortexed for 1 min. (C) For reCIM, add 10 µL of the 0.5 M EDTA to the Eppendorf tube to obtain a final concentration of 5 mM EDTA. (D) The tube was incubated for 45 min at 37°C, subsequently vortexed for an additional minute, and then centrifuged for 5 min at 10,000 rpm (for highly mucoid strains, a second centrifugation step may be needed). (E) Five hundred µL of the supernatant was added to 2500 µL of an E. coli ATCC 25922 resuspended in TSB at a 1.0 McFarland. The tubes were incubated at 37°C for 2.5 h with a nephelometer reading taken every 30 min to assess the growth of the indicator E. coli strain. For indicator E. coli growth between 1.0 and 2.0, 30mins of additional incubation was beneficial. (F) Results of mrCIM and reCIM for strain with Ambler class B metallo-β-lactamases, with OD > 2.0 for mrCIM and OD < 1.0 for reCIM. (G) Results of mrCIM and reCIM for strain with Ambler class A serine β-lactamases, with OD > 2.0 for mrCIM and OD > 2.0 for reCIM. (H) Results of mrCIM and reCIM for strain without carbapenemase, with OD < 1.0 for mrCIM and OD < 1.0 for reCIM.
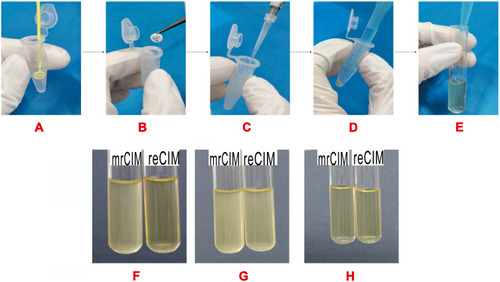
Table 1 Results from the Retrospective Study, Showing Agreements and Differences Between the mCIM and mrCIM, eCIM and reCIM for a Well-Characterized Set of Enterobacteriaceae. Results for 2.5 h Growth Time of the Indicator Strain
Table 2 Results from the Prospective Study, Showing Agreements and Differences Between the mrCIM, reCIM and Molecular Results. Results for 2.5 h Growth Time of the Indicator Strain
Figure 2 Dynamics of E. coli indicator strain growth in mrCIM in the retrospective study. Box and whisker plot showing the dynamics of growth of the E. coli ATCC 25922 indicator strain from the retrospective study (n=247). Measurements were made every 30 min after supernatant challenge of the indicator strain. Carbapenemase producers and non-producers are presented side by side for each measurement time point. Results represent baseline-subtracted growth, and are expressed as McFarland units. Filled circles represent outliers. The blue horizontal line marks the 1.0 McFarland carbapenemase negative cut-off chosen, and the red line marks the 2.0 McFarland carbapenemase positive cut-off.
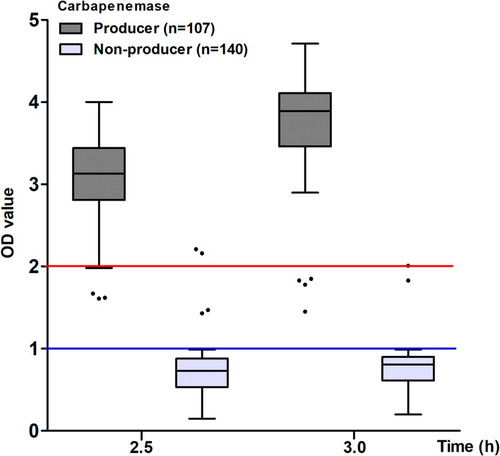
Figure 3 Dynamics of E. coli indicator strain growth in reCIM in the retrospective study. Box and whisker plot showing the dynamics of growth of the E. coli ATCC 25922 indicator strain from the retrospective study (n=97). Measurements were made every 30 min after supernatant challenge of the indicator strain. Class A carbapenemase producers and class B carbapenemase producers are presented side by side for each measurement time point. Results represent baseline-subtracted growth, and are expressed as McFarland units. Filled circles represent outliers. The blue horizontal line marks the 1.0 McFarland metallo-carbapenemase negative cut-off chosen, and the red line marks the 2.0 McFarland metallo-carbapenemase positive cut-off.
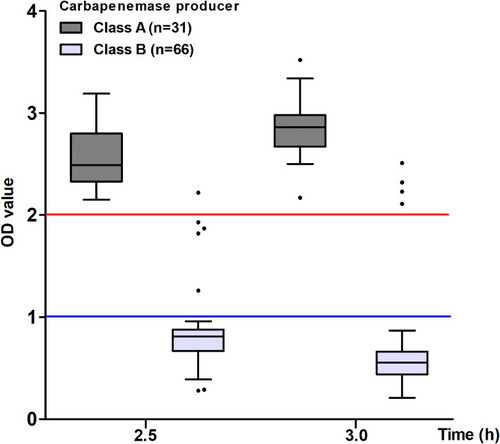
Figure 4 Dynamics of E. coli indicator strain growth in mrCIM in the prospective study. Box and whisker plot showing the dynamics of growth of the E. coli ATCC 25922 indicator strain from the prospective study (n=47). Measurements were made every 30 min after supernatant challenge of the indicator strain. Carbapenemase producers and non-producers are presented side by side for each measurement time point. Results represent baseline-subtracted growth, and are expressed as McFarland units. Filled circles represent outliers. The blue horizontal line marks the 1.0 McFarland carbapenemase negative cut-off chosen, and the red line marks the 2.0 McFarland carbapenemase positive cut-off.
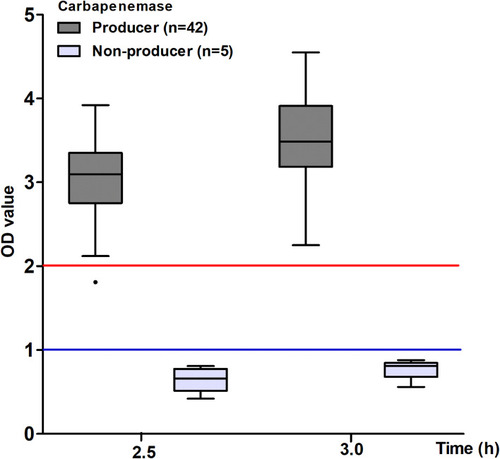
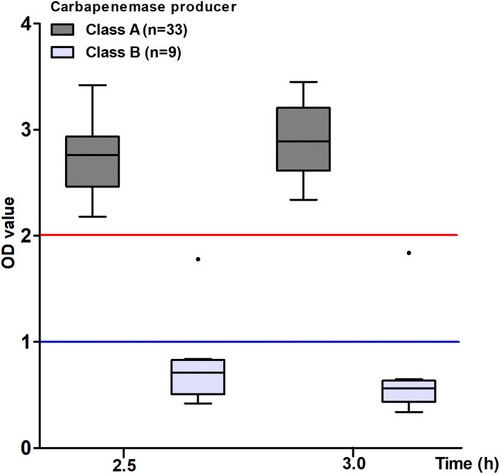
Figure 5 Dynamics of E. coli indicator strain growth in reCIM in the prospective study. Box and whisker plot showing the dynamics of growth of the E. coli ATCC 25922 indicator strain from the prospective study (n=42). Measurements were made every 30 min after supernatant challenge of the indicator strain. Class A carbapenemase producers and class B carbapenemase producers are presented side by side for each measurement time point. Results represent baseline-subtracted growth, and are expressed as McFarland units. Filled circles represent outliers. The blue horizontal line marks the 1.0 McFarland metallo-carbapenemase negative cut-off chosen, and the red line marks the 2.0 McFarland metallo-carbapenemase positive cut-off.