Figures & data
Figure 1 Minimum inhibitory concentration of free ciprofloxacin and ciprofloxacin-loaded niosomal preparations against tested S. aureus strains.
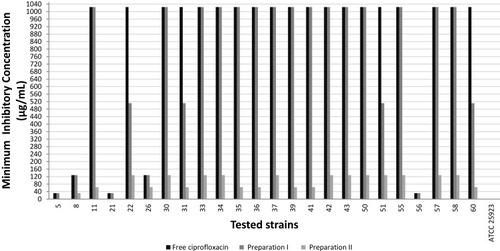
Figure 2 Characterization of the prepared ciprofloxacin-loaded niosomes using dynamic light scattering technique. (A) Size distribution histogram, (B) zeta potential distribution.
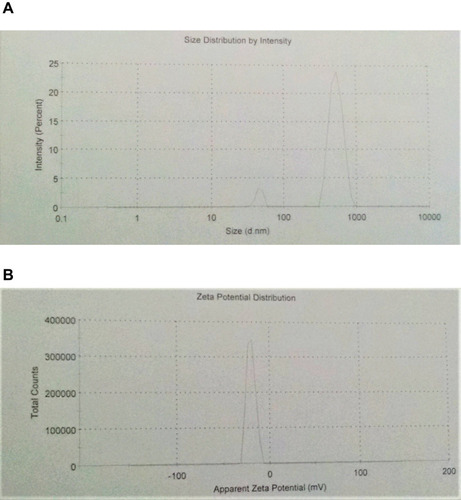
Table 1 Minimum Biofilm Inhibitory Concentration and Minimum Biofilm Eradication Concentration of Free Ciprofloxacin Solution and Ciprofloxacin-Loaded Noisomal Preparation II against S. aureus Isolates
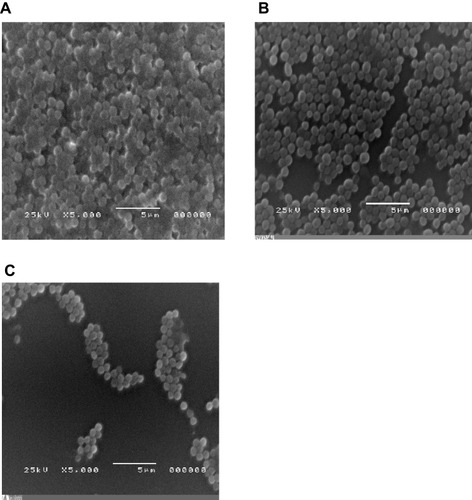
Figure 3 Visualization of S. aureus biofilms formed in the presence of subinhibitory concentration of free ciprofloxacin and ciprofloxacin-loaded niosomes, using an electron microscope. (A) Untreated culture (positive control), (B) culture in the presence of 1/8 MIC of ciprofloxacin, (C) culture in the presence of 1/8 MIC of ciprofloxacin-loaded niosomes.