Figures & data
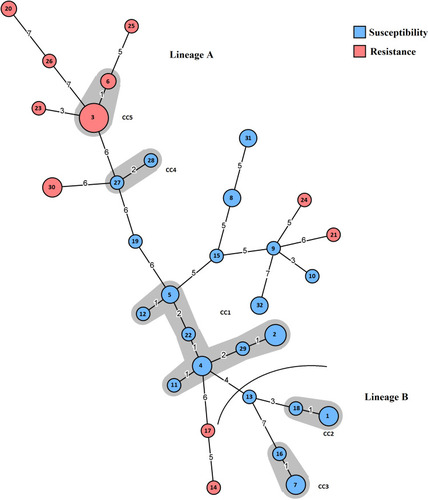
Figure 1 Minimum spanning tree analysis of the 65 M. hominis isolates based on eMLST data. Each circle corresponds to a distinct allelic profile, and the circle size corresponds to the number of isolates sharing the same profile. The circle was coded by assigning the color blue to sensitive-tetracycline eSTs and the color pink to resistant-tetracycline eSTs. The shaded zones between certain groups of circles indicate that these profiles belong to the same clonal complex (CC). Numerals connecting the circles indicate the number of allelic differences between the profiles.