Figures & data
Figure 1 Observed (2000–2017), fitted (2001–2016), and predicted (2017) cases of hemorrhagic fever with renal syndrome (HFRS). Black solid line: observed cases; black dashed line: model fitted curve; red solid lines: upper bound of 95% confidence intervals for fitted values and 95% confidence limits for predicted values; blue solid lines: lower bound of 95% confidence intervals for fitted values and 95% confidence limits for predicted values.
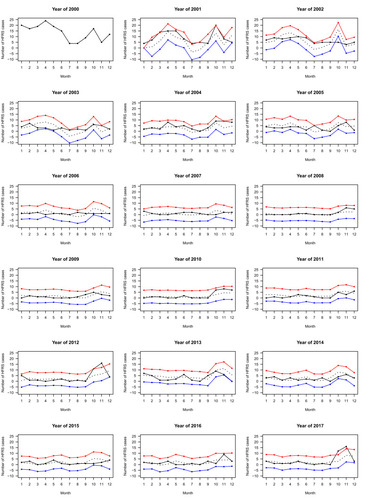
Figure 2 Spatial distribution of hemorrhagic fever with renal syndrome (HFRS) incidence per 100,000 population from 2000 to 2017 (Panel (A)–Panel (R)) and their average incidence (Panel (S)) in each town (each town is represented by a black dot with its name).
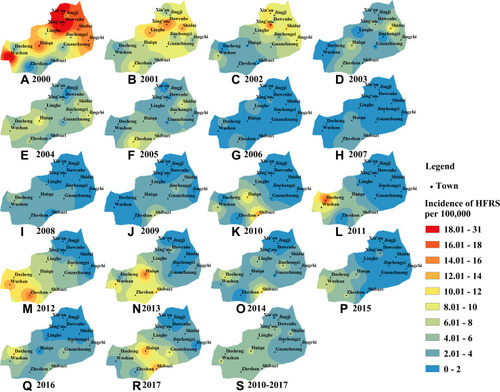
Table 1 Comparison of Candidate SARIMA Models
Table 2 Parameter Estimation for the Selected model
Table 3 Comparison of Observed Cases and Predicted Cases of Hemorrhagic Fever with Renal Syndrome (HFRS) from January 2017 to December 2017
Figure 3 Analysis of autocorrelation and partial autocorrelation plots original time series, first-order difference series, and residuals of the model of monthly cases of hemorrhagic fever with renal syndrome (HFRS).
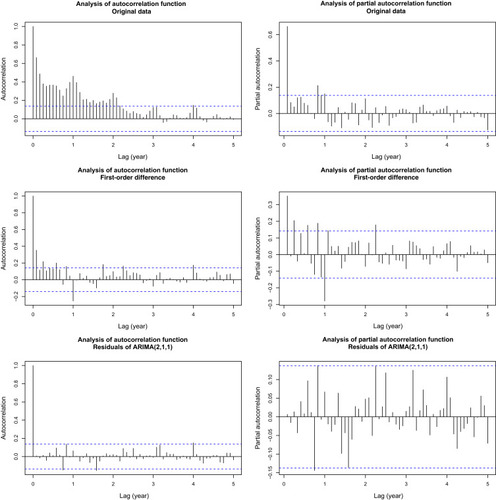
Table 4 Univariate Generalized Additive Model Analysis of Meteorological Factors on Monthly Incidence of Hemorrhagic Fever with Renal Syndrome
Table 5 Multivariate Generalized Additive Model Analysis of Meteorological Factors on Monthly Incidence of Hemorrhagic Fever with Renal Syndrome
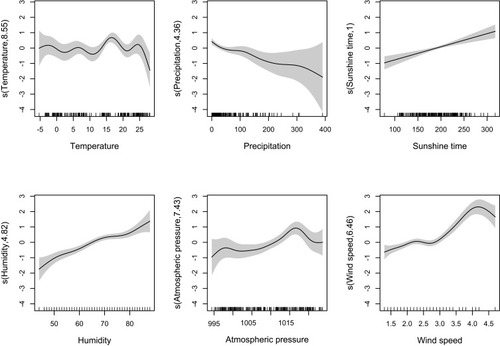
Figure 4 Estimated smooth functions of six meteorological factors on monthly incidence of hemorrhagic fever with renal syndrome (HFRS). Shaded areas represent 2 times standard errors above and below the estimate of the smooth functions.