Figures & data
Table 1 Gene-Specific Primers Used for Relative Quantification of Genes Expressions by RT-PCR
Figure 1 Preparation of AMP-17 recombinant protein. SDS-PAGE analysis of AMP-17 recombinant protein from the E. coli expression (lane 1, expression plasmid pET-AMP17 without IPTG; lane 2, expression plasmid pET-AMP17 with IPTG; lane 3, supernatant after disruption of cells; lane 4, sediment after disruption of cells; lane 5, purified protein; M: protein marker).
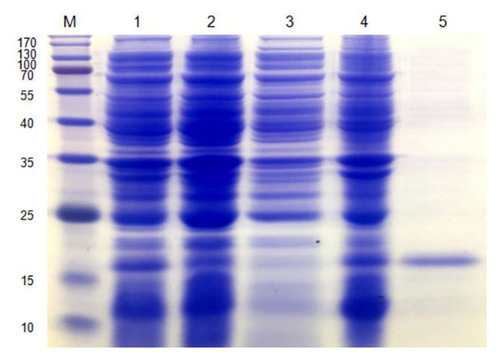
Figure 2 Observation of the morphological changes of C. albicans by optical microscopy (400×). (A and B) Untreated C. albicans cells are healthy, with the budding cells and pseudohyphae. (C and D) and (E and F) C. albicans treated with AMP-17 (40 μg/mL) at 8 h and 16 h, respectively, showed significantly reduced budding cells and filamentous pseudohyphae, and the cells aggregated and lysed. The bars indicate 50 μm.
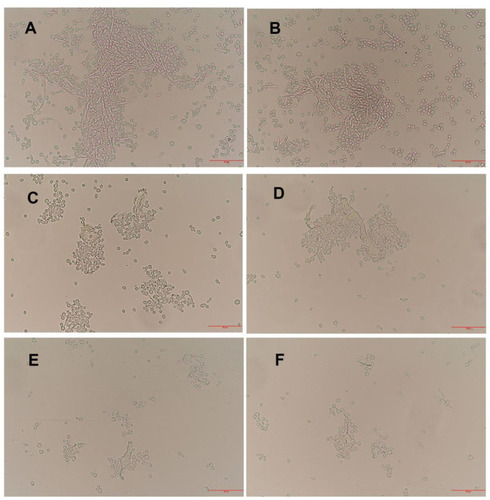
Figure 3 SEM images of the effect of AMP-17 on the morphological structure of C. albicans. (A and B) Untreated C. albicans cells are intact, with plump appearance, smooth surface, and clear cell boundaries. (C and D) C. albicans treated with AMP-17 (40 μg/mL) at 8 h showed severe irregularities in shape, and cells adhered tightly to each other; Some diseased cells ruptured and leaked out their contents (red arrowheads). (E and F) C. albicans treated with AMP-17 (40 μg/mL) at 16 h showed lysed cells and some cell debris (red arrowheads). At two time points, pseudohyphae could not be observed. The bars indicate 20 μm.
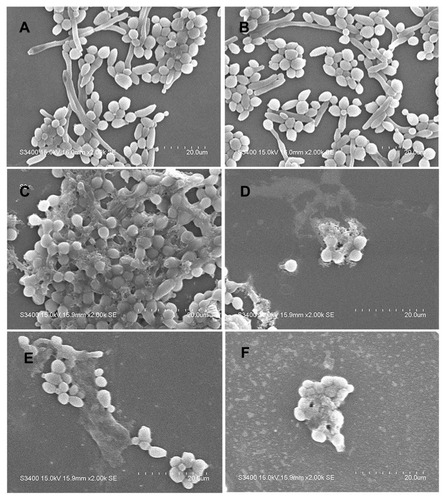
Table 2 Effect of AMP-17 on the Cell Wall Integrity of Candida albicans
Figure 4 The effect of AMP-17 on the cell wall of C. albicans observed by light microscopy after cell wall staining (400×). (A) Untreated C. albicans cells. (B) C. albicans treated with 40 μg/mL AMP-17 at 37°C for 12 h. (C) C. albicans treated with 20 μg/mL of caspofungin at 37°C for 12 h.
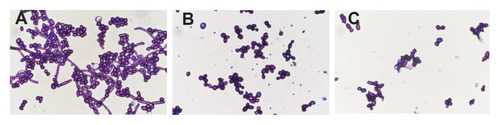
Figure 5 Effect of AMP-17 on the cell membrane structure of C. albicans. Cells were treated with various concentrations of AMP-17 or 8 μg/mL of AMB (positive control) for 12 h following with DPH staining for spectrofluorophotometric detection (*P<0.05, **P<0.01). Bars indicate the standard deviations.
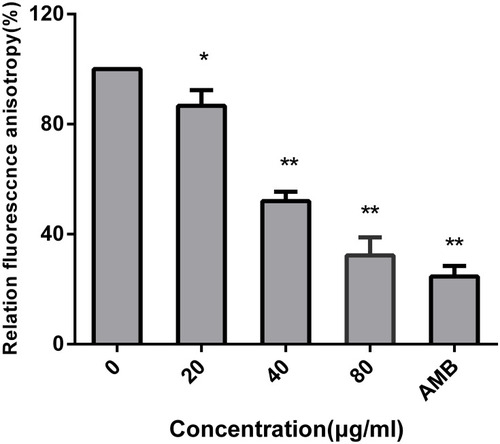
Figure 6 Effect of AMP-17 on permeability of C. albicans cell membrane (600×). C. albicans cells were incubated with 0 (control), 20, 40, and 80 μg/mL AMP-17 at 37°C for 12 h. After staining with 20 μg/mL propidium iodide, the red fluorescence in samples was detected by confocal laser scanning microscopy at 488 nm and 525 nm of excitation and emission, respectively. The bars indicate 10 μm.
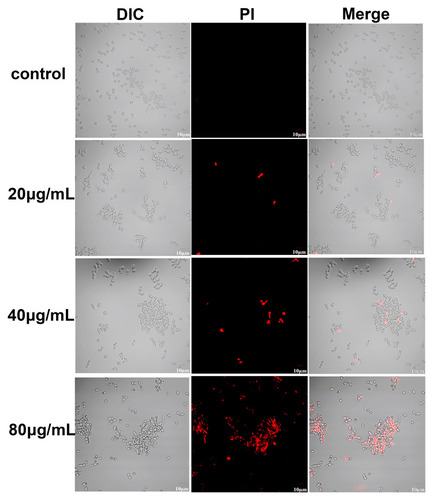
Figure 7 Effect of AMP-17 on intracellular glycerol concentration of C. albicans. (A) The concentration of intracellular glycerol was measured using the Glycerol Assay Kit after treatment with various concentrations of AMP-17 for 12 h. (B) The total RNA was extracted with the Yeast RNAiso Kit and the expressions of HOG1 and RHR2 were measured using qPCR. Bars indicate standard deviations (*P<0.05, **P<0.01).
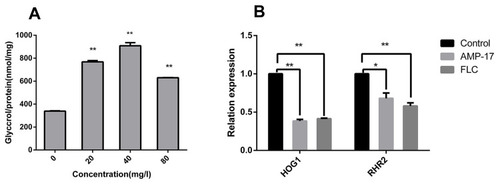
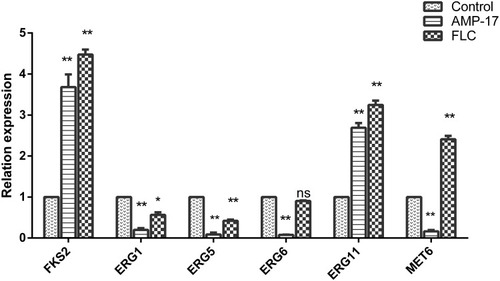
Figure 8 Expression of AMP-17 on C. albicans cell membrane and cell wall associated genes. After treatment with 40 μg/mL of AMP-17 for 12 h, the total RNA was extracted with the Yeast RNAiso Kit and the expressions of genes related with cell membrane synthesis and cell wall assembly were assessed using qPCR (*P<0.05, **P<0.01). Bars indicate standard deviations.