Figures & data
Table 1 Distribution of Enterobacterales, CR-Enterobacterales and CS-Enterobacterales from 2015 to 2017 in IAIs, UTIs and RTIs (N, %)
Table 2 Ranges of MIC50, MIC90 and Susceptible (%), Intermediate (%) and Resistant (%) Rates of Enterobacterales to Carbapenems and Colistin Between 2015 and 2017
Table 3 MIC Distribution of Colistin Between 2015 and 2017 in IAI, RTI and UTI Isolates
Figure 1 Changes in the of indicated Enterobacterales sensitivity to colistin over time for the indicated infection types.
Note: #means that the susceptibility of CR-K. aerogenes in 2015 was not available.
Abbreviations: IAI, intra-abdominal infections; UTI, urinary tract infections; RTI, respiratory tract infections; CR, carbapenem-resistant.
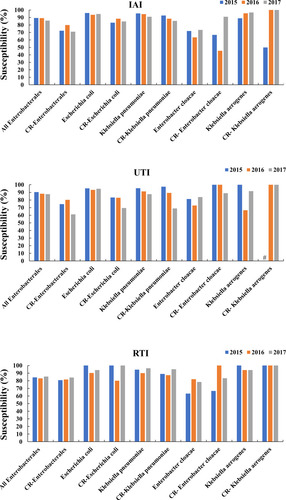
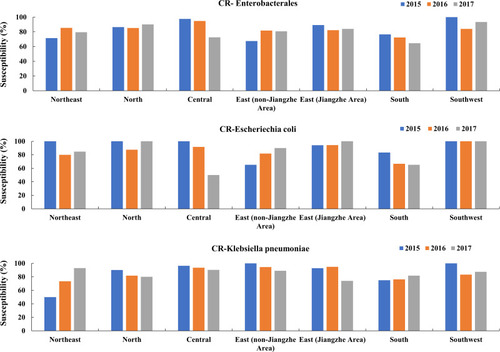
Figure 2 Changes in the susceptibility of CR-Enterobacterales, CR-E. coli and CR-K. pneumoniae to colistin over time in different regions of China.
Abbreviation: CR, carbapenem-resistant.