Figures & data
Table 1 Antimicrobial Susceptibility of fosA10-Carrying Escherichia coli Strain PK9 and Transconjugant or Transformant
Figure 1 Phylogenetic tree obtained for the FosA proteins. The protein GenBank accession numbers are FosATN(FosA1), AAA98399; FosA2, ACC85616; FosA3, AB522970; FosA4, AB908992; FosA5, AJE60855; FosA6, NG051497; FosA7, KKE03230; FosA8, CP013990; FosA9, PRJEB32329; and FosA10, MT74415.
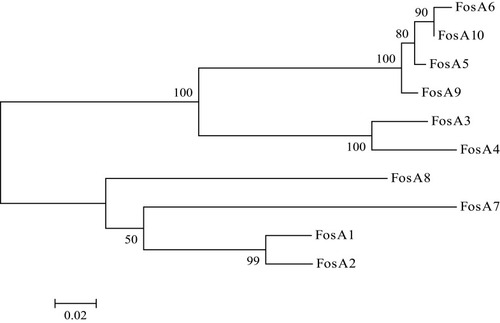
Figure 2 Map of pHNPK9-FOS. The map was carried out by BLAST tools, Sequin (version 15.50), BLAST Ring Image Generator (BRIG, version 0.95), Serial Cloner (version 2.6.1), and SnapGene (version 4.1.9). The outermost two rings indicate the size and plasmid type of pHNPK9-FOS, respectively. The next ring shows features extracted from the genome GenBank file of pHNPK9-FOS. The next two rings show GC content and GC skew. Each is plotted as the deviation from the average for the entire sequence.
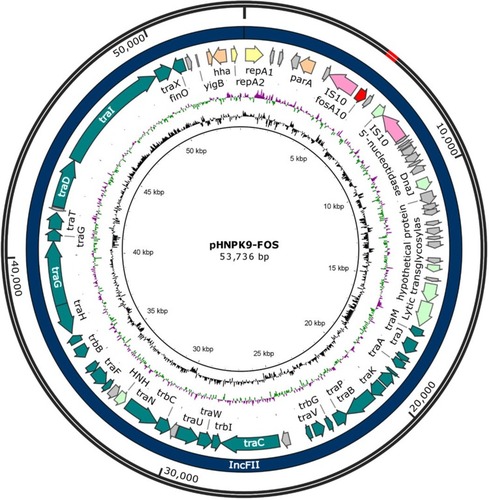
Table 2 Resistance Genes and Plasmids Carried by Escherichia coli Strain PK9
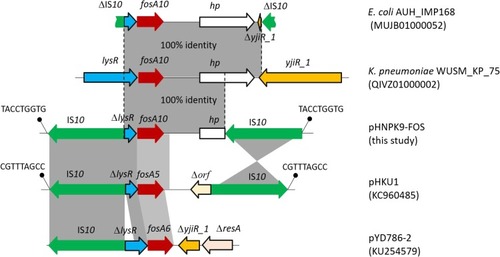
Figure 3 Genetic structure surrounding the new fosA10 gene, fosA5, and fosA6 gene. Genes and ISs are indicated by bold arrows. DR sequences are represented by diagonal bars. 100% and 98%~97% sequence identities were denoted by dark gray shading and light gray shading, respectively.