
Figures & data
Figure 1 Flow diagram of patients screening and recruitment.
Abbreviations: CAP, community-acquired pneumonia; HAP, hospital-acquired pneumonia; VAP, ventilator-associated pneumonia.
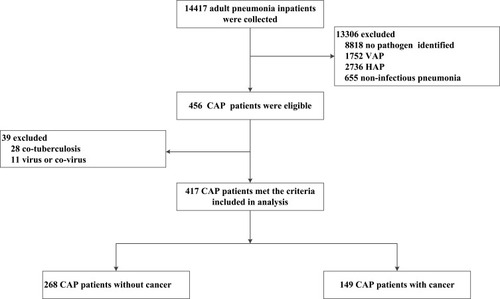
Figure 2 Prevalence of different types of cancers.
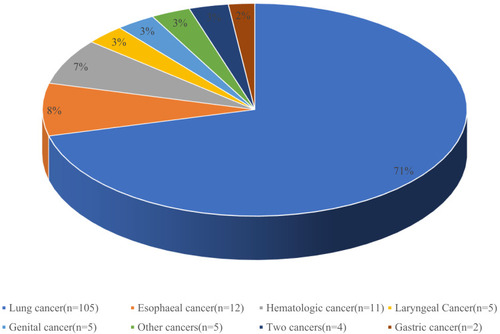
Figure 3 Seasonal distribution of Streptococcus pneumoniae among CAP patients with cancers and without cancers between September 2018 and August 2019.
Abbreviations: CAP, community-acquired pneumonia; NC, no cancer; C, cancer.
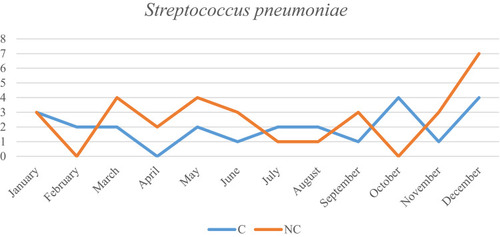
Figure 4 Seasonal distribution of Klebsiella pneumoniae among CAP patients with cancers and without cancers between September 2018 and August 2019.
Abbreviations: CAP, community-acquired pneumonia; NC, no cancer; C, cancer.
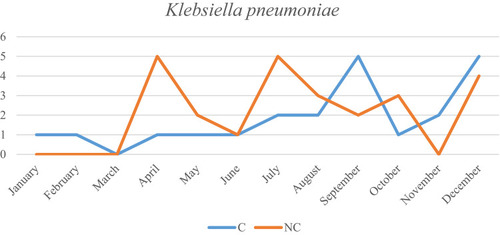
Figure 5 Seasonal distribution of predominant pathogens among overall CAP patients between September 2018 and August 2019.
Abbreviation: CAP, community-acquired pneumonia.
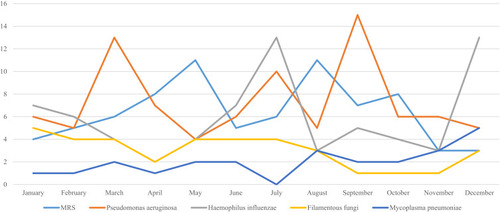
Table 1 Characteristics of CAP Patients with and Without Cancers (n = 417)
Table 2 Etiologic Microorganisms of CAP Patients with and Without Cancers (n = 417)
Table 3 Overall Distribution of Pathogens as Isolated Alone and/or in Combination with Other Pathogens (Mixed Infection)
Table 4 Univariate and Multivariate Logistic Regression Analyses of CAP Patients Without Cancers
Table 5 Univariate and Multivariate Logistic Regression Analyses of CAP Patients Without Cancers