Figures & data
Table 1 Demographic Data of Patients Included in This Study
Table 2 Summary of MIC Results Among the 22 M. odoratimimus Isolates
Table 3 Primers for the Carbapenemase Gene Sequencing Analysis
Figure 1 PFGE image of the M. odoratimimus strains. The 22 isolates belonged to six distant PFGE groups (types A–F) by using a cut-off of 80% similarity (Δurology department, □biliary and pancreatic surgery department).
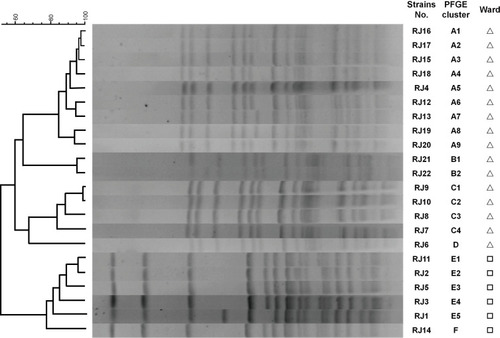
Figure 2 MALDI-TOF MS dendrograms for 22 isolates. Using PCA cluster analysis to construct a dendrogram, MALDI-TOF MS generated four clusters (types I, II, III, and IV) with a cut-off value of 3.
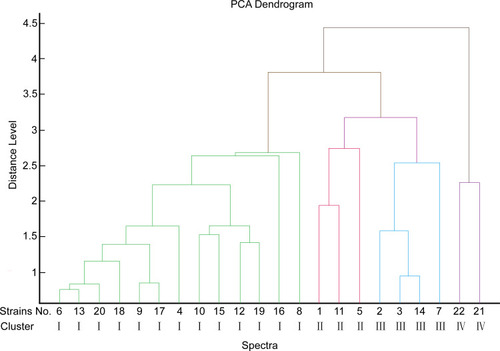
Figure 3 The level of resistance to meropenem between the clinical isolates of MUS-1 from the biliary and pancreatic surgery ward and MUS-3 from the urology ward (P < 0.05).
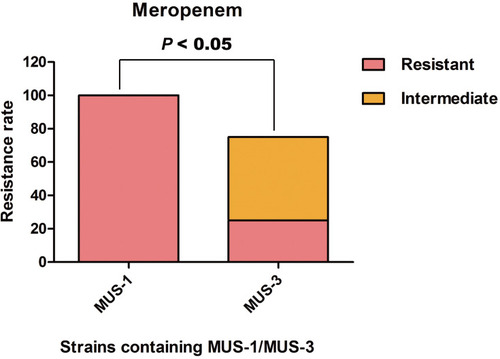
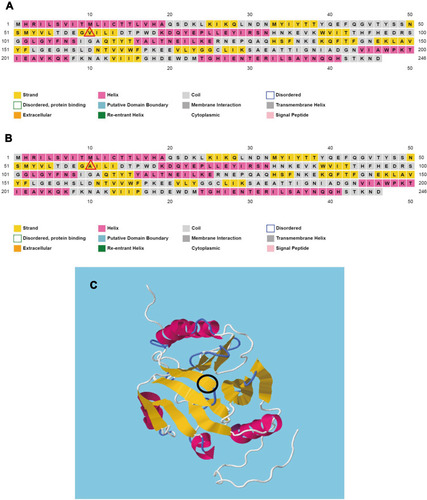
Figure 4 The secondary and tertiary structure prediction of MUS-1 wild-type and V60A-mutant proteins using bioinformatics tools. (A) Secondary structure prediction of the MUS wild-type protein by PSIPRED. (B) Secondary structure prediction of the MUS-3 (V60A) mutant protein by PSIPRED. A beta-strand is predicted to form at the mutation position (red triangle). (C) Tertiary structure prediction of the MUS protein by RaptorX, with the mutation marked inside (black oval).