Figures & data
Figure 1 Patient recruitment and flow through study.
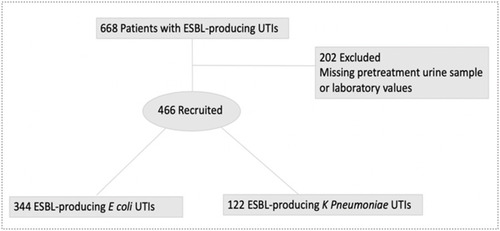
Table 1 Demographic and Clinical Characteristics of Patients with ESBL-Positive UTIs
Figure 2 Comparison of circulatory inflammatory markers, including CRPs and NLR between two ESBL-positive UTI groups in accordance with T2DM status. (A, B) Serum CRP and blood NLR levels between E. coli and K. pneumonia in all ESBL-UTI cases. Representative data showing that patients with ESBL-E. coli UTIs had lower serum CRP levels and higher blood NLR compared to ESBL-K. pneumoniae UTIs. (C, D) Serum CRP and blood NLR between E. coli and K. pneumonia in T2DM ESBL-UTI cases. Representative data showing that T2DM patients with ESBL-E. coli UTIs had lower serum CRP levels and higher blood NLR compared to ESBL-K. pneumoniae UTIs. (E, F) Serum CRP and blood NLR between E. coli and K. pneumonia in non-T2DM ESBL-UTI cases. Representative data showing that non-T2DM patients with ESBL-E. coli UTIs had both lower serum CRP levels and blood NLR compared to ESBL-K. pneumoniae UTIs.The values of serum CRP and blood NLR levels were reported in median and IQR. Two-way comparison was done using Mann–Whitney test. * P<0.05, ** P<0.001, ns= non-significant.
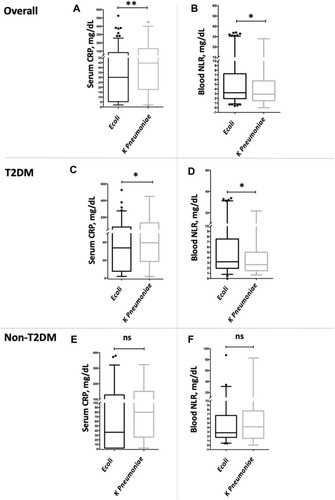
Figure 3 Association of circulatory inflammatory markers, including CRPs and NLR, in the two ESBL-positive UTI groups in accordance with T2DM status. (A) Risk of CRP ≥ 35 mg/dL in all ESBL-UTI cases, T2DM, and non-T2DM. Representative data showing that T2DM patients with serum CRP ≥ 35 mg/dL were at higher risk for ESBL-E. coli UTIs than for ESBL-K. pneumoniae UTIs. (B) Risk of NLP ≥ 35 mg/dL in all ESBL-UTI cases, T2DM, and non-T2DM. Representative data showing that T2DM patients with blood NLR ≥ 3.5 were at higher risk for ESBL-E. coli UTIs than for ESBL-K. pneumoniae UTIs. Adjusted for age, gender, serum albumin, hemoglobulin, leukocytes, and platelet counts.
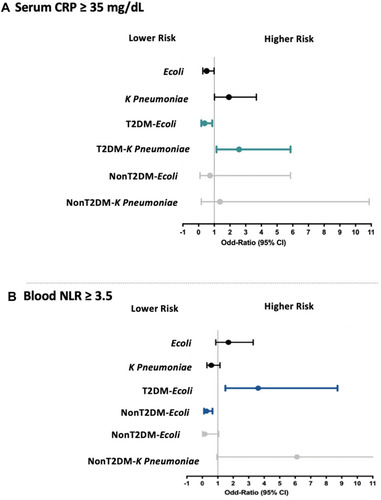
Figure 4 Comparison of urinary IL-8 level between the two ESBL-positive UTI groups in T2DM. *** P<0.0001.
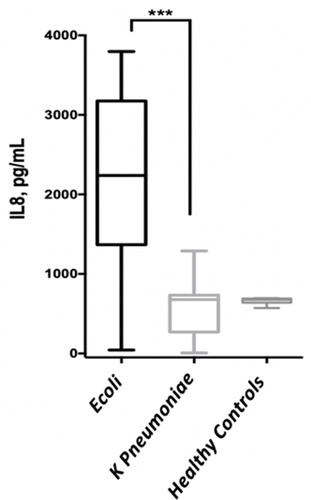
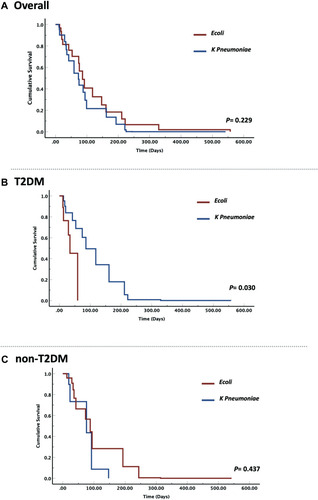
Figure 5 Hazard ratios and cumulative survival curve in the two ESBL-positive UTI groups in accordance with T2DM status. (A) Risk estimate for all-cause mortality between E. coli and K. pneumonia in all ESBL-UTI cases. Representative data showing that the risk was non-significant for ESBL-E. coli and K. pneumoniae uropathogens in all ESBL-UTI cases. (B) Risk estimate for all-cause mortality between E. coli and K. pneumonia in T2DM ESBL-UTI cases. Representative data showing that T2DM with ESBL-E. coli had higher risk of all-cause mortality than those with ESBL-K. pneumoniae. (C) Risk estimate for all-cause mortality between E. coli and K. pneumonia in non-T2DM ESBL-UTI cases. Representative data showing that the risk was non-significant for ESBL-E. coli and K. pneumoniae uropathogens in non-T2DM.