Figures & data

Table 1 Demographic and Clinical Characteristics of the Development and Validation Groups
Table 2 Univariate and Multivariate Logistic Regression Models in the Development Group
Figure 1 Nomogram to predict the probability of risk of death from A. baumannii infection.
Abbreviations: CCI, Charlson comorbidity index; CRAB, carbapenem-resistant Acinetobacter baumannii; CSF, cerebrospinal fluid; MV, mechanical ventilation.
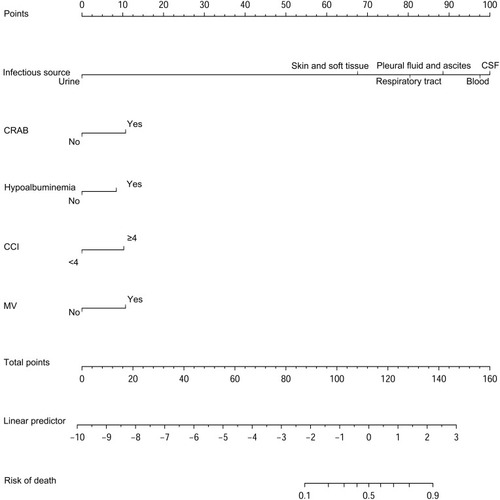
Figure 2 Example of prediction nomogram for the risk of death from A. baumannii infection.
Abbreviations: CCI, Charlson comorbidity index; CRAB, carbapenem-resistant Acinetobacter baumannii; CSF, cerebrospinal fluid; MV, mechanical ventilation.
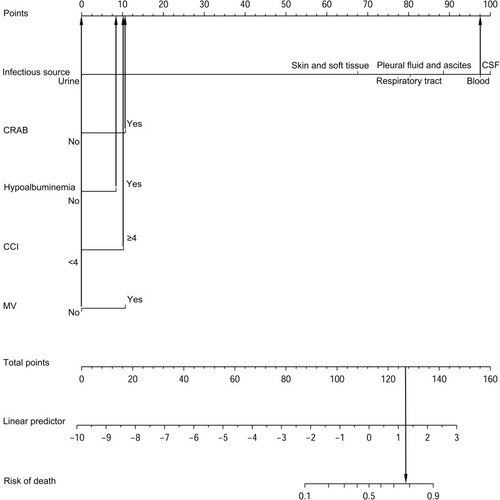
Table 3 ROC Curve Analysis of the Development Group and Validation
Figure 3 ROC curves for validating the discrimination of the nomogram. (A) Development group (B) Validation group (AUC = 0.768 vs 0.792).
Abbreviations: AUC, area under the curve; ROC, receiver operating characteristic.
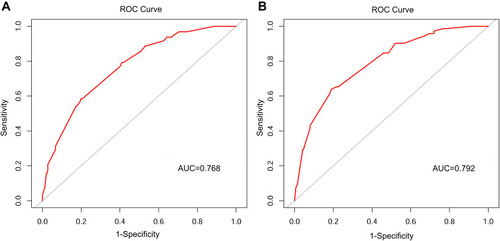
Figure 4 DCA curves for validating the net income of the nomogram. (A) Development group (B) Validation group.
Abbreviation: DCA, decision curve analysis.
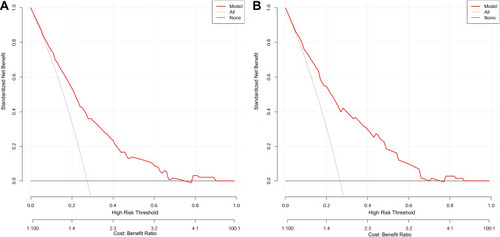
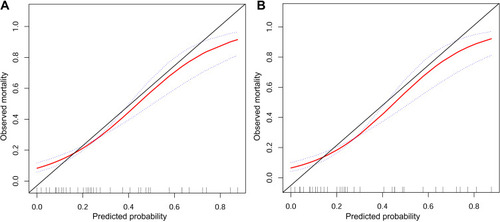
Figure 5 Calibration curves for validating the calibration of the nomogram. (A) Development group (B) Validation group.