Figures & data
Table 1 The MICs of Luteolin Against T. pyogenes
Figure 1 Effect of luteolin on the growth curve of T. pyogenes. Data are presented as mean (± SD) of three replicates.
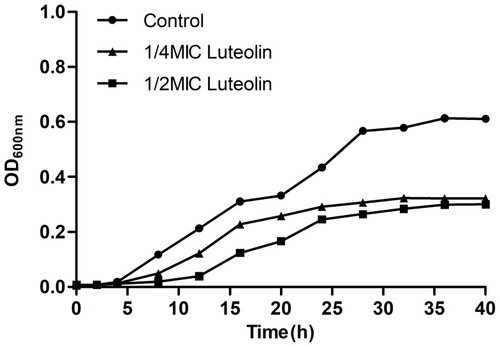
Figure 2 Effect of luteolin on the cell wall integrity of T. pyogenes. (A) Leakage of AKP from T. pyogenes after treatment with luteolin. Data are presented as mean (± SD) of three replicates (compared with the control, ** P < 0.01). (B) Fluorescence intensity of NPN after treatment with different concentrations of luteolin. Data are presented as mean (± SD) of three replicates.
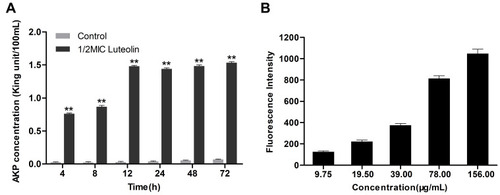
Figure 3 Effect of luteolin on the cell membrane of T. pyogenes. (A) Leakage of β-galactosidase from T. pyogenes after treatment with luteolin. Data are presented as mean (± SD) of three replicates. (B) Fluorescence microscopy images of T. pyogenes in control group and luteolin treatment group. (C) Cell membrane potential variation of T. pyogenes after treatment with luteolin. Data are presented as mean (± SD) of three replicates.
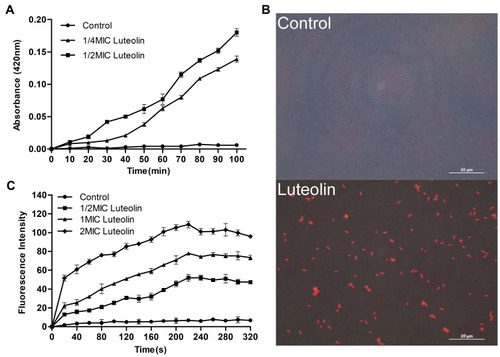
Figure 4 TEM images of T. pyogenes. (A and E) Bacteria untreated with luteolin. (B and F) Bacteria treated with 1/2 MIC luteolin for 12 h. (C and G) Bacteria treated with 1/2 MIC luteolin for 24 h. (D and H) Bacteria treated with 1/2 MIC luteolin for 36 h.
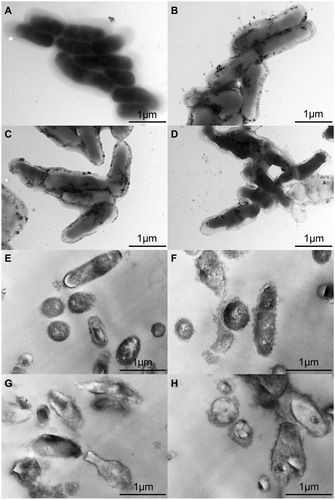
Figure 5 Effect of luteolin on the expression of proteins in T. pyogenes. (A) Changes of total protein content after luteolin treatment. Data are presented as mean (± SD) of three replicates (compared with the control, ** P < 0.01). (B) SDS-PAGE profiles of total cell proteins. M: Molecular weight marker; 1, 3 and 5: T. pyogenes of control group cultured to 12, 24 and 36h, respectively; 2, 4 and 6: T. pyogenes treated with luteolin for 12, 24 and 36h, respectively.
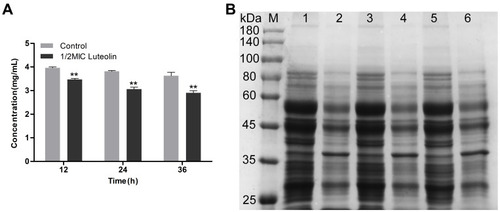
Figure 6 Effect of luteolin on the nucleic acid content in T. pyogenes. (A) Changes of fluorescence intensity of nucleic acid after treatment with luteolin. Data are presented as mean (± SD) of three replicates (compared with the control, ** P < 0.01). (B) Fluorescence microscopy images of T. pyogenes after 1/2 MIC luteolin treatment for 12 h, 24 h and 36 h, respectively.
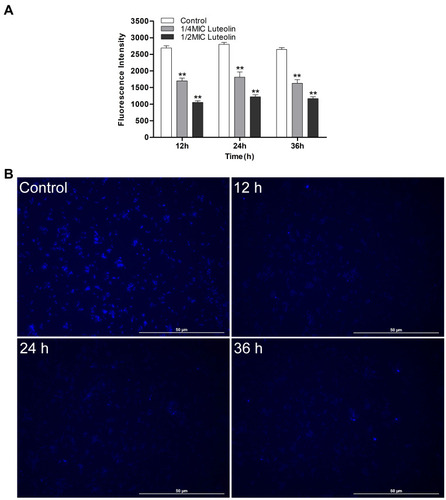
Figure 7 UV spectra of interaction of luteolin and DNA.
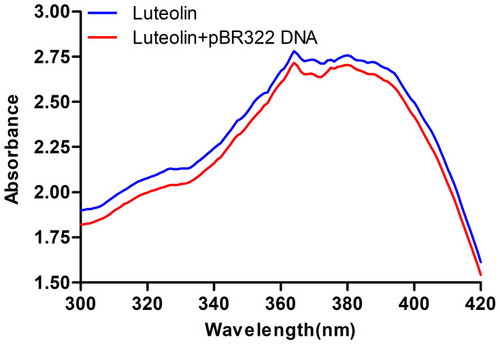
Figure 8 Effect of luteolin on topoisomerase I and II of T. pyogenes. a: pBR322; b–h: control and luteolin with different concentrations (1/4MIC,1/2MIIC, 1MIC, 2MIC, 4MIC, 8MIC).
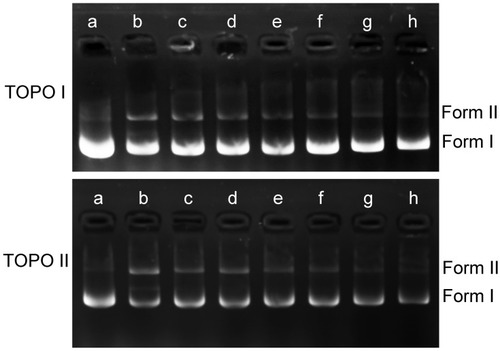
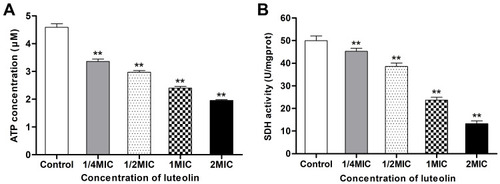
Figure 9 Effect of luteolin on energy metabolism of T. pyogenes. (A) Effect of luteolin on the ATP content in T. pyogenes. Data are presented as mean (± SD) of three replicates (compared with the control, ** P < 0.01). (B) Effect of luteolin on the SDH activity in T. pyogenes. Data are presented as mean (± SD) of three replicates (compared with the control, ** P < 0.01).