
Figures & data
Table 1 Constituent Ratios of Departments Where the Samples Originated from
Table 2 Sequences of CRISPR/Cas Spacers Matching Plasmids or Phages
Figure 1 Presence of (A) Cas1 and (B) Cas3 genes by PCR. M indicates the DNA marker. The numeric characters represent the sequential number of different K. pneumoniae isolates.
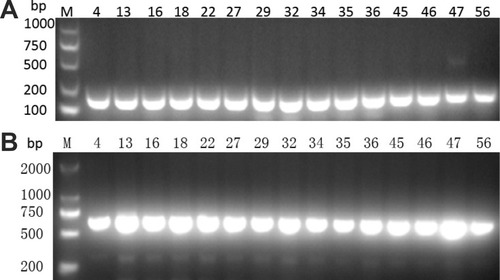
Figure 2 Presence of CRISPR2 gene by PCR. M indicates the DNA marker. The numeric characters represent the sequential number of different K. pneumoniae isolates which carry the CRISPR2 gene.
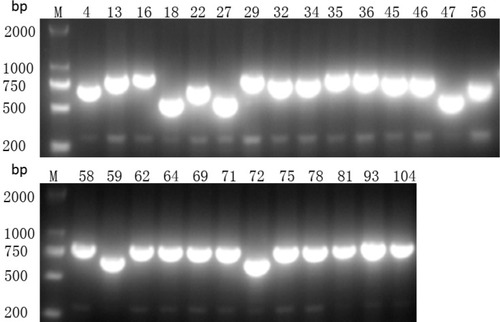
Figure 3 Presence of CRISPR3 gene by PCR. M indicates the DNA marker. The numeric characters represent the sequential number of different K. pneumoniae isolates which carry the CRISPR3 gene.
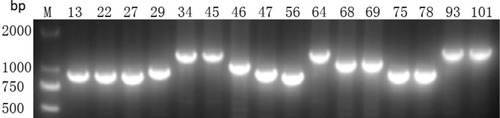
Table 3 Genetic Characterization of 136 Isolates of K. pneumoniae
Table 4 The Distribution of Drug Resistance Genes Between CRISPR/Cas-Positive and -Negative Isolates of K. pneumoniae
Table 5 Drug Resistance Pattern Between CRISPR/Cas-Positive and -Negative Isolates of K. pneumoniae