Figures & data
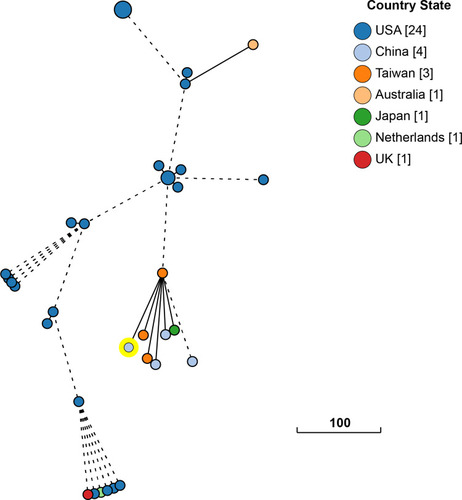
Figure 1 The axial T2WI image shows a small strip of a hypersignal lesion near the left lateral ventricle (A). The lesion presented hyperintensity on FLAIR (B) and no significant diffuse obstruction on DWI (C). No significant enhancement (D) was observed in the GD-DTPA enhanced sequence.
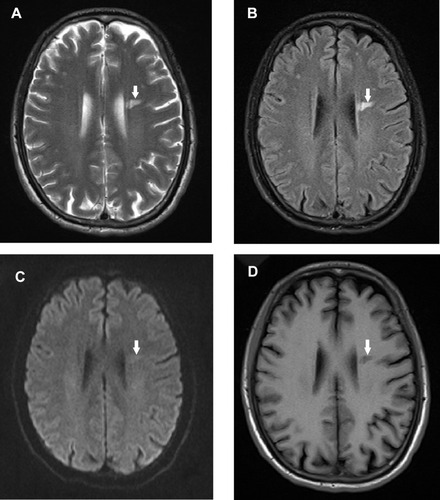
Figure 2 The time course of linezolid administration and the onset of thrombocytopaenia.
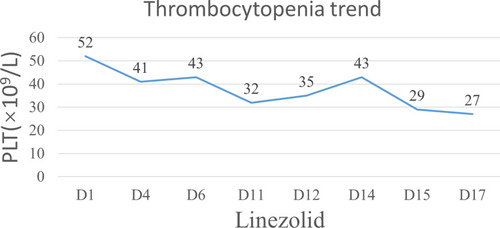
Figure 3 Phylogenetic relationship between S. aureus SA17 and closely related S. aureus ST59 strains currently deposited in the NCBI GenBank database. The lines connecting the circles indicate the clonal relationships between different isolates. The scale bar represents a pairwise allelic difference of 100 cgMLST loci.