
Figures & data
Table 1 Primers Used for the Amplification of Genes
Table 2 Antibiotic Susceptibility Pattern of A. baumannii Isolates
Table 3 Characteristics of A. baumannii Strains
Table 4 The Relationship Between Biofilm Formation and Related Genes in A. baumannii Strains with MDR and XDR Phenotypes
Figure 1 Gene expression comparison of pmrA and pmrB in colistin-resistant (Ab 4, Ab41) and susceptible isolates (Ab49, Ab61, Ab69, Ab22, Ab26, Ab7, Ab32, Ab37) and A. baumannii ATCC 19606.
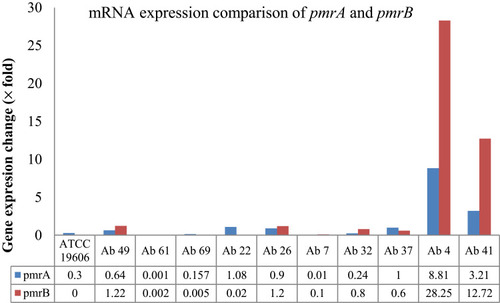
Table 5 The Relation Between Biofilm Intensity with Antibiotic Susceptibility, Phenotype, and IC