Figures & data
Figure 1 Results of phylogenetic trees; Bayesian classification, MIC test, and ARGs identification of 19 samples from ICU rooms. Sampling time, lineages of hierBAPS, presence/absence of blaKPC-2 and blaNDM-1 are annotated as colored bars next to the isolate number. (A) Phylogenetic trees of high abundance species from core genome alignments. Maximum likelihood phylogenetic trees from core genome alignments; Tree branches are colored by MLST types. (B) Results of MIC test; class of antibiotics and resistance strength are annotated as colored bars next to the main heatmap. (C) Results of ARGs identification; presence/absence of ARGs are annotated as colored bars next to the main heatmap.
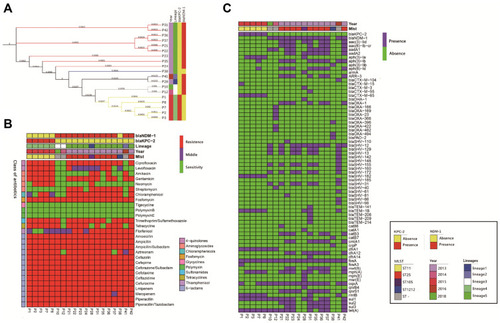
Figure 2 Distribution of K. pneumoniae and carbapenem resistance genes (CRGs) (blaKPC-2 and blaNDM-1); Types of CRGs are annotated by different colors. All STs are based on the Pubmlst MLST scheme. (A) Distribution of carbapenem resistance genes of CRGs in K. pneumoniae genomes from NCBI in the ST type with large abundance or with blaKPC-2 or blaNDM-1 for display. (B) Geographical distribution of CRGs in K. pneumoniae genomes from NCBI (only countries with ≥1 CRG-containing genome are shown). Countries are shown on the y-axis and the numbers on the x-axis indicate the number of CRGs. (C) Distribution of carbapenem resistance genes of CRGs in K. pneumoniae genomes from Shunde hospital.
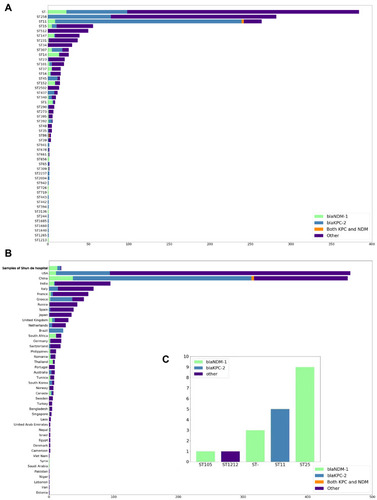
Figure 3 Geographic distribution and MLST typing results of K. pneumoniae samples in different countries and regions of genomic samples from NCBI and Shunde hospital; The color shades on the map represent the number of samples. The pie chart link with black line to China on the main map represents the MLST typing results of samples from Shunde hospital. The pie chart next to the main map represents MLST typing results of 13 countries.
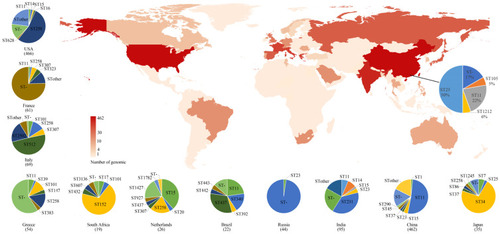
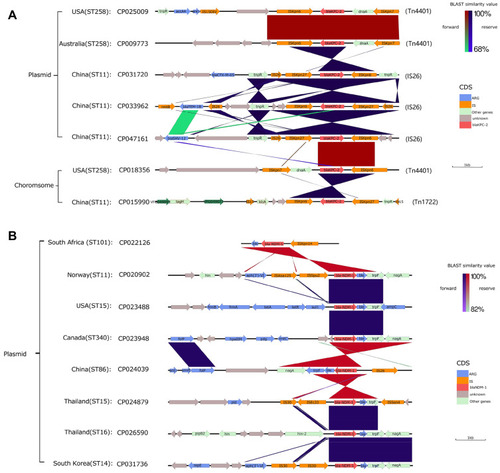
Figure 4 blaKPC-2 and blaNDM-1 gene environment and comparison of some representative samples; BLAST similarity values and the types of different CDS are annotated by different colors next to the main chart (A) Gene environment of blaKPC-2 (B) Gene environment of blaNDM-1.