
Figures & data
Table 1 Primer Sequences and PCR Conditions
Table 2 Distribution of the Three Microorganisms Among Subjects Positive or Negative for H. Pylori
Figure 1 Gel electrophoresis for PA431C gene to determine the prevalence of P. aeruginosa. The band size was 232 bp. Samples 5–8 were positive, whereas 3 and 4 were negative clinical samples.
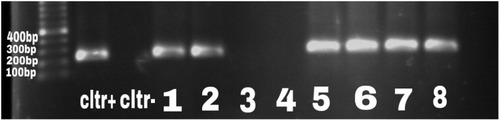
Figure 2 Gel electrophoresis for nuc gene to determine the prevalence of S. aureus. The band size was 279 bp; sample 8 was the positive control. Samples 3, 5, and 7 were considered as positive clinical samples.
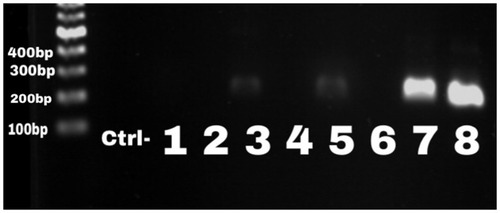
Table 3 Incidence of the Three Microorganisms Among Patients with the Three Digestive Conditions