
Figures & data
Table 1 Oligonucleotide Sequences Used in This Study
Table 2 Antibiotic Susceptibility Profiles in Clinical Isolates of P. aeruginosa
Figure 1 ai: The result of phenotypic detection of ESBL-producing Pseudomonas aeruginosa by Double-Disk Confirmatory Test (DDCT) in Pseudomonas aeruginosa. A: Ceftazidime (30 µg); B: ceftazidime + clavulanate (30/10µg); C: cefotaxime + clavulanate (30/10µg); D: cefotaxime (30 µg). Top: ESBL negative strain; Bottom: ESBL positive strain; ESBL positive isolates show an increase of 5 mm zone of inhibition with clavulanic acid as compared to the zone size for CTX and CZD alone. aii: The result of phenotypic detection of MBL-producing Pseudomonas aeruginosa by EDTA-imipenem microbiological (EIM) test in Pseudomonas aeruginosa. A: EDTA + imipenem; B: imipenem. Top: MBL positive strain; Bottom: MBL negative strain; MBL considered positive when zone diameter difference between imipenem + EDTA and imipenem discs was larger than 7 mm.
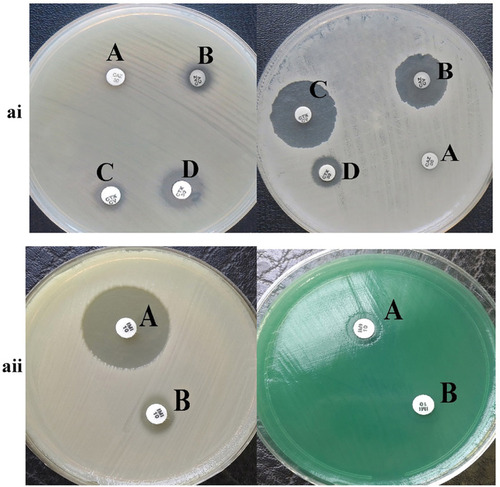
Figure 2 The result of phenotypic detection of carbapenemase-producing Pseudomonas aeruginosa by Modified Hodge test (right) and Carba-NP test test (left) in Pseudomonas aeruginosa. ai A: control negative strain; B: KPC negative strain by Carba-NP test test; C: KPC positive strain by Carba-NP test test. aii D: KPC positive strain by Modified Hodge test; (E) KPC negative strain by Modified Hodge test.
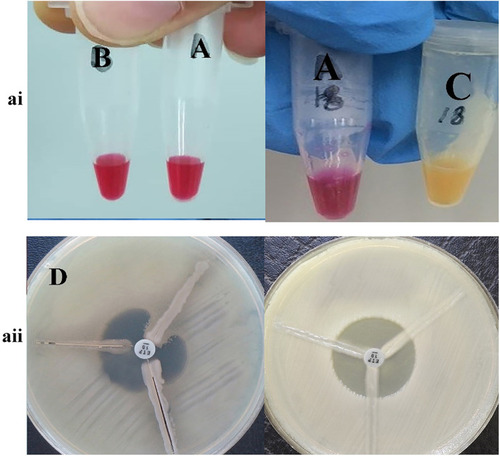
Figure 3 Phylogenetic tree of β-lactamases genes based on the gene sequencing of the class A and class B β-lactamases in P. aeruginosa isolates.
Abbreviations: MDR, multidrug-resistant; Com, chromosomal genes; Pls, plasmid genes; CAZ, ceftazidime; DOR, doripenem; MER, meropenem; IMI, imipenem; CPE, cefepime; GEN, gentamycin; CIP, ciprofloxacin; AK, amikacin; NOR, norfloxacin; AZT, aztreonam; TOB, tobramycin; PIP, piperacillin; PI/TA, piperacillin/tazobactam.
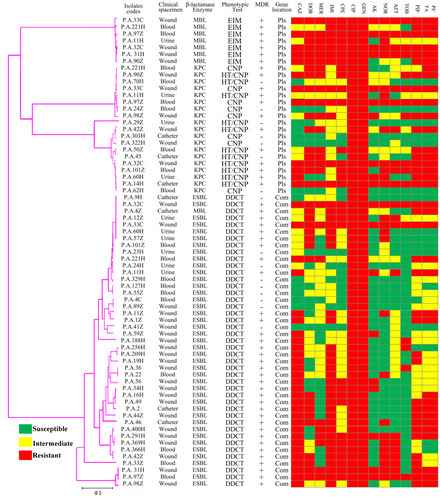
Figure 4 Analytical sensitivity of Real-time PCR for primers used to detect class B β-lactamases genes in clinical isolates of P. aeruginosa. ai to aiii: blaGES; ai: Melting curve in 86.86°C; aii: Amplification curve; and aiii: Standard curve with efficiency=1.808. bi to biii: blaIMP gene; bi: Melting curve in 80.16°C; bii: Amplification curve; and biii: Standard curve with efficiency=1.742. ci to ciii: blaVIM gene; ci: Melting curve in 84.84°C; cii: Amplification curve; and ciii: Standard curve with efficiency=1.575. The mean of a: 108; b: 107; c: 106; d: 105; e: 104; f: 103; g: 102; h: 101 and i: 10° CFU/mL of DNA dilutions. Horizontal lines represent cycle threshold of Real-time PCR. One peak with a shoulder corresponds to genomic DNA amplification; no peak corresponds to no amplification. SYBR Green I Dye and single-tube reaction were used in this test. Also, Real-Time PCR was performed as single-step.
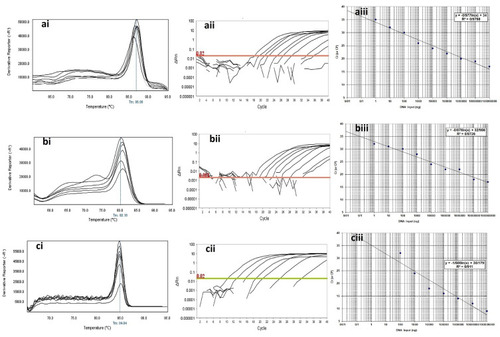
Figure 5 Analytical sensitivity of real-time PCR for primers used to detect class A β-lactamases genes in clinical isolates of P. aeruginosa. ai to aiii: blaTEM gene; ai: Melting curve in 82.4°C; aii: Amplification curve; and aiii: Standard curve with efficiency=1.429. bi to biii: blaSHV gene; bi: Melting curve in 88.52°C; bii: Amplification curve; and biii: Standard curve with efficiency=1.742. ci to ciii: blaKPC gene; ci: Melting curve in 83.55°C; cii: Amplification curve; and ciii: Standard curve with efficiency=1.575. The mean of a: 108; b: 107; c: 106; d: 105; e: 104; f: 103; g: 102; h: 101 and i: 10° CFU/mL of DNA dilutions. Horizontal lines represent cycle threshold of Real-time PCR. One peak with a shoulder corresponds to genomic DNA amplification; no peak corresponds to no amplification. SYBR Green I Dye and single-tube reaction were used in this test. Also, Real-Time PCR was performed as single-step.
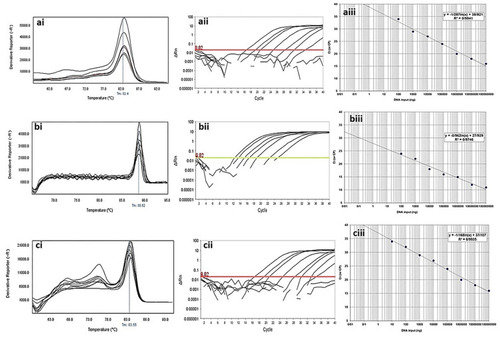
Figure 6 The result of molecular detection of class A β-lactamases genes by HRMA assay. a: blaSHV with 245 bp length and a melting temperature of 88.57±0/5°C; b: blaTEM with 101 bp length and a melting temperature of 82.4±0/5°C; c: blaKPC with 245 bp length and a melting temperature of 83.55±0/5°C. β-lactamases producing genes were amplified successfully using the EvaGreen Dye in the ABI Step-OnePlus machine by one-sept protocol. Primers specific melting peaks were obtained via HRMA analysis, allowing the differentiation of all investigated β-lactamase enzymes. Due to the highly saturating EvaGreen dye and the HRMA analysis, the accuracy of the resolution was ±0. 1–0.5 °C. (ai, bi, and ci) Melting curves; (aii, bii, and cii) normalized plot; and (aiii, biii, and ciii) difference plot.
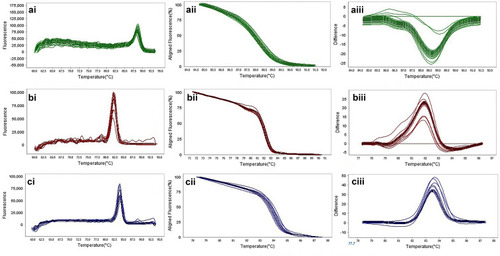
Figure 7 The result of molecular detection of class B β-lactamases genes by HRMA assay. a: blaGES with 72 bp length and a melting temperature of 86.86±0/5°C; b: blaIMP with 114 bp length and a melting temperature of 80.16±0/5°C; c: blaVIM with 105 bp length and a melting temperature of 84.80±0/5°C. β-lactamases producing genes were amplified successfully using the EvaGreen Dye in the ABI Step-OnePlus machine. Primers specific melting peaks were obtained via HRMA analysis, allowing the differentiation of all investigated β-lactamase enzymes. Due to the highly saturating EvaGreen dye and the HRMA analysis, the accuracy of the resolution was ±0. 1–0.5 °C. (ai, bi, and ci) Melting curves; (aii, bii, and cii) normalized plot; and (aiii, biii, and ciii) difference plot.
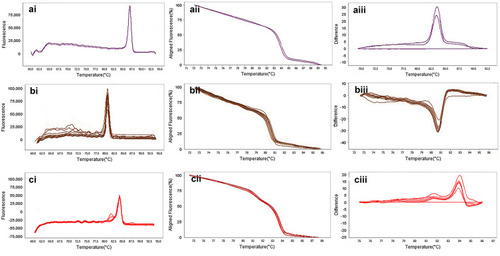
Table 3 Sensitivities, Specificities, Positive Predictive and Negative Predictive Values for Phenotypic and HRMA (blaSHV Gene for ESBL-Producing, blaKPC Gene for Carbapenemase-Producing and blaVIM Gene for MBL-Producing) Methods in β-Lactamase-Producing Strain of P. aeruginosa
Table 4 Sensitivities, Specificities, Positive Predictive and Negative Predictive Values for Phenotypic and HRMA (blaTEM Gene for ESBL-Producing, blaIMP Gene for Carbapenemase-Producing and blaGES Gene for MBL-Producing) Methods in β-Lactamase-Producing Strain of P. aeruginosa
Table 5 Relationship of Antibiotic Susceptibility Profiles, β-Lactamase Class and Sensitivity/Specificity of Phenotypic and HRMA in Clinical Isolates of P. aeruginosa