Figures & data
Figure 1 Schematic diagram of the amplified region.
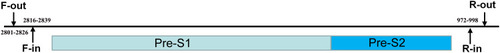
Table 1 Demographic and Clinical Features of Patients of Patients
Table 2 Proportion Comparison of Patients with Pre-S Quasispecies Deletion Patients in the Two Groups
Figure 2 Quasispecies frequencies of the Pre-S deletion in HIV/HBV co-infection and HBV mono-infection patients. (A) Comparison for the Pre-S deletion; (B) comparison for the Pre-S1 deletion; and (C) comparison for the Pre-S2 deletion.
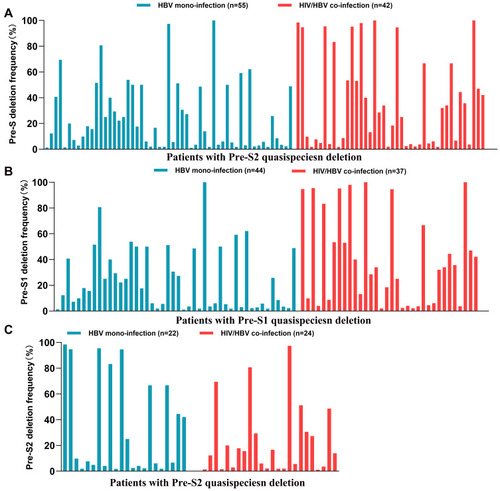
Table 3 Frequency Comparison of Functional Deletion in HBV Pre-S Region Between the Two Groups
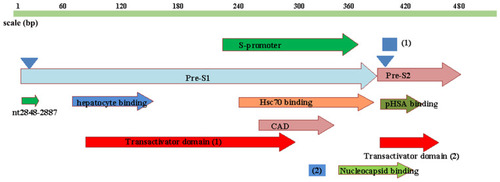
Figure 3 Schematic diagram of the functional domains of HBV Pre-S1 and Pre-S2. (1): Viral secretion (nt 3205–4); (2): CCAAT-binding factor (CBF) binding site (nt 3137–3147); S-promoter (nt 3045–3180); hepatocyte binding site (nt 2908–2988); nucleocapsid binding site (nt 3155–4); cytosolic anchorage determinant (CAD) at nt 3088–3162; polymerized human serum albumin (pHSA)-binding site (nt 3211–37); heat shock protein 70 (Hsp70)-binding site (nt 3067–3201). The transactivator domain contains two regions, which are at nt 2908–3117 and 3205–48; the first triangle: N-linked myristylation at N-2 of the L protein; the second triangle: N-linked glycosylation at N-4 of the M protein. nt 1848–2887 are located in the N-terminus of Pre-S1.