Figures & data
Figure 1 Experimental overview for generation of induced LZD and PA-824 dual drug-resistant MTB strains (LPDR mutants, marked as LP or PL strains) in vitro from M. tuberculosis H37Rv.
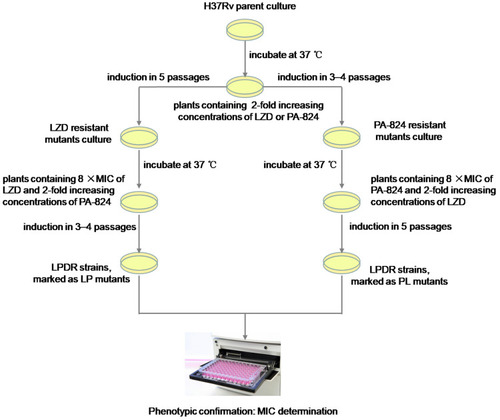
Table 1 Linezolid (LZD) and Pretomanid (PA-824) Mono- or Dual-Resistant Mutant Strains of M. tuberculosis
Figure 2 Growth of mutant strains through colony forming units (CFU) counts in an M. tuberculosis H37Rv background.
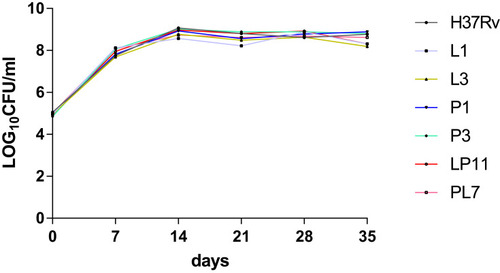
Figure 3 BALB/c mice survival after intravenous infection via the tail vein. Kaplan–Meier survival curves of groups of 16 mice infected with six representative mutants, or H37Rv strain. The median survival times of BALB/c mice were 27.5, undefined, 83, 63.5, 67, 68.5, and 57 days in the H37Rv, L1, L3, P1, P3, LP11 and PL7 groups, respectively.
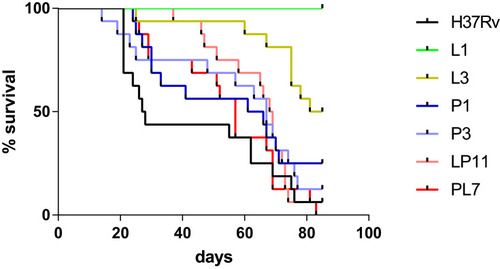
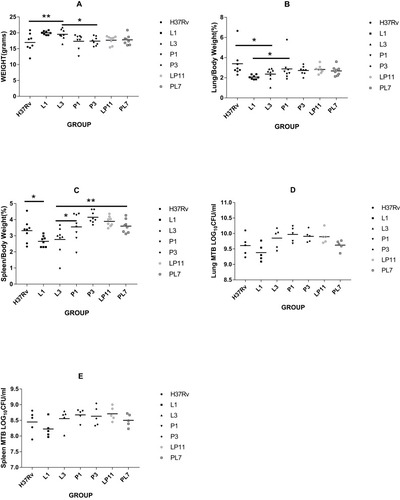
Figure 4 Four weeks post-infection with M. tuberculosis in BALB/c mice. The body mass (A), organ mass ratio (B, C), and the total organ CFU counts (D, E) in each group. Eight mice each group were sacrificed at 4 weeks post-infection, of which body weight and weights of each lung and spleen were measured. Among them, lungs and spleens of 5 mice each group were removed for organ CFU counts. Statistically significant differences compared with infected groups are shown: *P< 0.05; **P< 0.01.