Figures & data
Table 1 Minimal Inhibitory Concentrations (MICs) of K. Pneumoniae K60, K65, K77 and Their rmtF-Positive Escherichia Coli Transconjugants
Figure 1 PFGE of K. pneumoniae K60, K65 and K77. Lanes 1, marker Salmonella braenderup H9812; line 2 to 4, PFGE image of K. pneumoniae K60, K65 and K77.
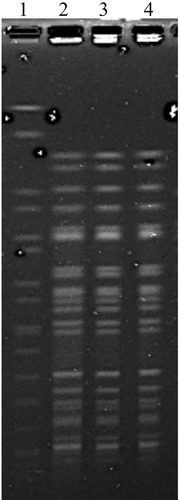
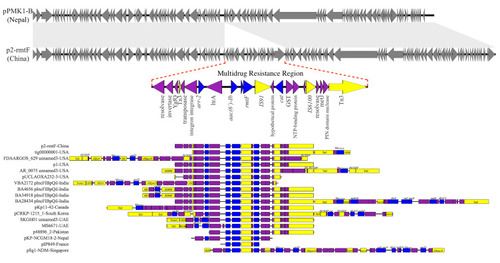
Figure 2 Major structural features of P2, pPMK1-B and the MRR of other plasmids with rmtF gene. Plasmids sequenced analyzed were compared as follows: P2 was compared with pPMK1-B, the MRR of P2 was compared with the MRR of other plasmids carrying rmtF gene: tig00000001-USA (121,057-bp, NZ_CP021758.1), FDAARGOS_629 unnamed3-USA (138,560-bp, CP044045.1), p1-USA (142,764-bp, CP033947.1), AR_0075 unnamed3-USA (93,870-bp, CP032188.1), pUCLAOXA232-3-USA (83,730-bp, CP012569.1), VBA2172 pIncFIBpQil-India (127,300-bp, CP036321.1), BA4656 pIncFIBpQil-India (164,210-bp, CP035907.1), BA34918 pIncFIBpQil-India (164,195-bp, CP036193.1), BA28434 pIncFIBpQil-India (130,775-bp, CP036328.1), pKp11-42-Canada (146,695-bp, KF295829.1), pCRKP-1215_1-South Korea (130,922-bp, CP024839.1), SKGH01 unnamed 3-United Arab Emirates (84,941-bp, NZ_CP015503.1), MS6671-United Arab Emirates (84,940-bp, LN824138.1), p48896_2-Pakistan (114,815-bp, CP024431.1), pKP-NCGM18-2-Nepal (9812-bp, AB824739.1), pIP849-France (4710-bp, JQ808129.1), pSg1-NDM-Singapore (90,103-bp, NZ_CP011839.1). Grey symbols indicate identical plasmid regions of P2 and pPMK1-B, while gray shading indicates >99% identity of them, and the red dotted line indicates their different component. Resistance genes are indicated by blue symbols. Transposon-related genes the class 1 integrase gene, and insertion sequences are indicated by yellow symbols. Other genes are indicated by violet symbols. Labels common to these MRRs appear only in the P2 diagram.