Figures & data
Figure 1 SDS-PAGE analysis of purified recombinant protein of α-toxin by Ni-NTA resin M: prestained Protein Ladder (Sinaclon, Iran) (10–170 kDa), Cat No. SL7011 (PR911654); Lanes A and B indicate second and fourth eluted fraction of recombinant protein of E. coli BL21 (DE3) transformed with pET28a/-α- toxin-6×His tags.
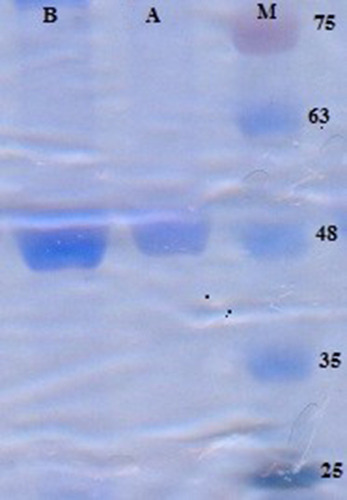
Figure 2 Western blot analysis of purified recombinant protein of α-toxin-6×His tags. M: prestained Protein Ladder (Sinaclon, Iran). Lane A: Negative control E. coli strain BL21 (DE3). Lane B purified recombinant protein of E. coli BL21 (DE3) transformed with pET28a/-α-toxin-6×His tags shows one band at 48 kDa.
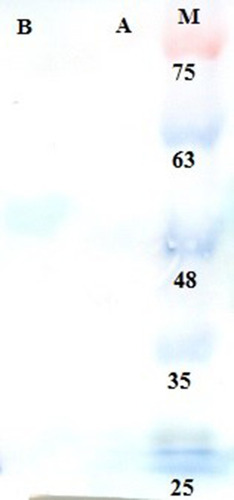
Table 1 The Mean of the IC50 Level of Glucantime and α-Toxin (µg/Ml) in vitro
Figure 3 The CC50 of α-toxin on macrophages (A) The calculation of CC50 of α-toxin, using the results of different concentrations of α-toxin on macrophage (J774-A1) at 20 concentrations in serial dilution starting from 0.0003 ug mL−1. The percentage of cellular cytotoxicity, determined by MTS assay after treatment with the indicated doses of α-toxin after 1hr at 37°C. (B) IC50 of α-toxin, glucantime, α-toxin + glucantime and α-toxin (non-toxic dose)+ glucantime. The calculation of IC50 of glucantime and α-toxin using the results of different concentrations of glucantime or α-toxin on amastigote forms of L. major at 18 concentrations in serial dilution starting from 0.001 ug/mL. Moreover, for calculation of IC50 of glucantime + α-toxin, using the results of different concentrations of glucantime (0.001–200 ug mL−1) along with non-cytotoxic concentration of α-toxin (0.003 ug mL−1) on amastigote forms of L. major. The percentage of cellular viability, measured by counting the number of amastigotes in each macrophage by examining 100 macrophages on each coverslip and comparing them with those obtained in positive control with light microscope after 48 h incubation at 37°C, 5% CO2.
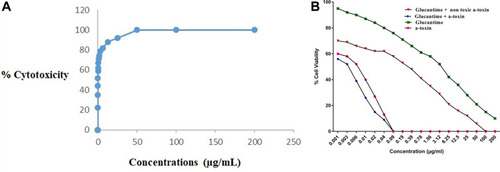
Table 2 Frequency Distribution of the Mean Size ± SD of the Ulcers in Different Groups (mm)
Figure 4 The mean size of lesions (mm) in control and test groups weekly. Diagrams show the therapeutic effect of treatment with α-toxin and glucantime on lesions due to infection of BALB/c mice L. major. Mice were infected with 1× 10⁶ stationary phase of L. major promastigotes in the tail base. After 21 days post-infection, the treatment course was started. Values show the mean lesion size ±SD of 10 mice per group (“*”shows significant difference (p < 0.05) and “**” shows significant difference (p < 0.001) among control and all other test groups).
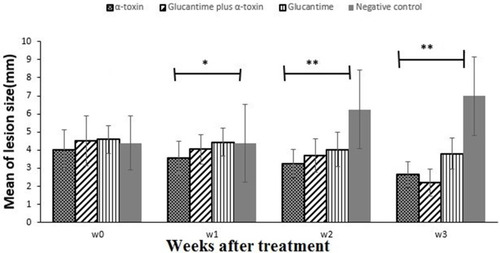
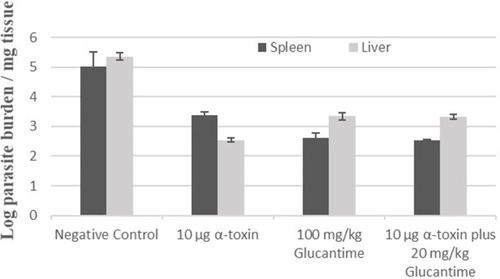
Table 3 The Mean Burden of Parasite in the Spleen/Liver of BALB/c Mice in Different Therapy Groups
Figure 5 The mean burden of the parasite in the spleen and liver of BALB/c mice of different groups. After the end of the treatment course, parasite numbers recovered from spleen and liver were evaluated by limiting-dilution assay. The error bars represent standard deviations (SD) of the mean.