
Figures & data
Figure 1 Average ODs of E. coli biofilm after different time intervals (2, 4, 10, and 24 hours). Bar graph shows weak biofilm formation at 2 and 4 hours (OD~0.08–0.11), moderate biofilm formation at 10 hours (OD~0.157), and mature biofilm at 24 hours (OD~0.20). Error bars show SD from the mean value of all 21 strains.
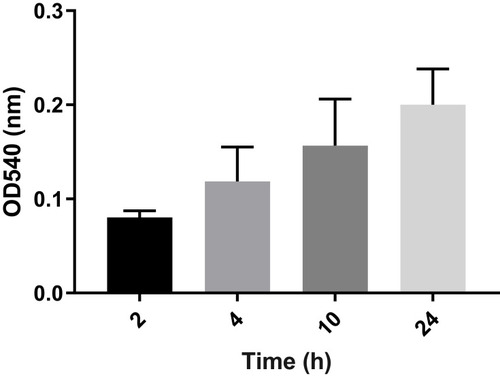
Figure 2 Scanning electron microscopy (SEM) images of Uropathogenic E. coli strain biofilms after 4 hours (left) and 10 hours (right).
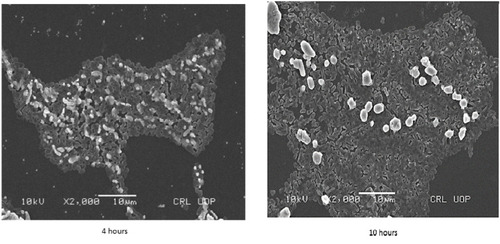
Table 1 Comparison of Minimum Inhibitory Concentration of Planktonic and Biofilm Forms Among UPEC Isolates
Table 2 Comparison of Antimicrobial Susceptibility Between MBIC and MBEC Among UPEC Isolates
Figure 3 Scanning electron microscopy (SEM) images showing untreated and levofloxacin treated 4 hours E. coli biofilm cells. Concentrations of levofloxacin was 50 μg/mL. Magnification: ×4000.
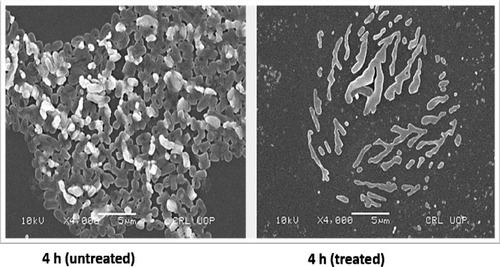
Figure 4 Scanning electron microscopy (SEM) images showing untreated and levofloxacin treated 18 hours E. coli biofilm cells. Concentrations of levofloxacin was 50 μg/mL. Magnification: ×5000.
Notes: a, Individual E. coli cells; b, exopolysaccharide.
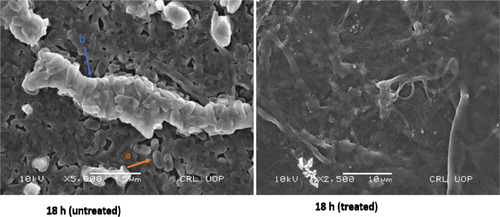
Table 3 Comparison of sub-MIC, MBIC, and MBEC of Ciprofloxacin Against Selected UPEC Strains
Table 4 Correlation Between Virulence Factors, Antibiotic Resistance, and Biofilm