
Figures & data
Figure 1 Flowchart of patients included.
Abbreviation: NHIS-NSC, National Health Insurance Service national sample cohort.
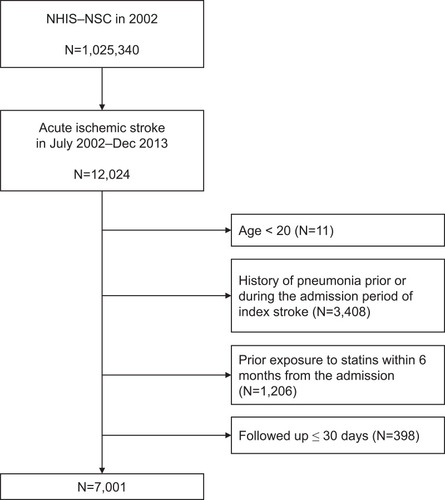
Table 1 Baseline Characteristics of Patients with Acute Ischemic Stroke
Table 2 Comparison of Characteristics Between Patients with Current Use of Statin and Those Without at 1-Year After Acute Ischemic Stroke
Figure 2 Proportion of patients with current of statin use throughout the poststroke period. The proportion was calculated by dividing the number of patients with current statin use by the number of patients still at risk of pneumonia at each time point.
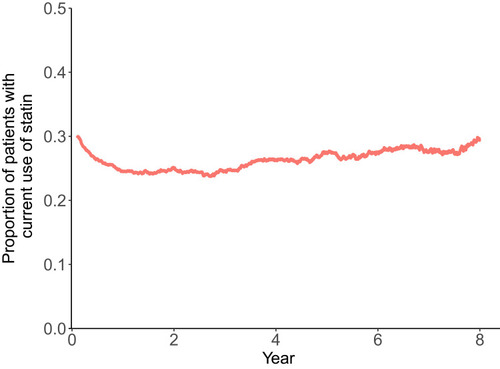
Table 3 Effects of Treatment with Statins on Risk of Poststroke Pneumonia
Figure 3 Estimated pneumonia-free probability according to treatment with statins (A) and according to intensity of statins (B) during follow-up. HRs for pneumonia and 95% CIs were derived from the univariate time-dependent Cox proportional hazard–regression model.
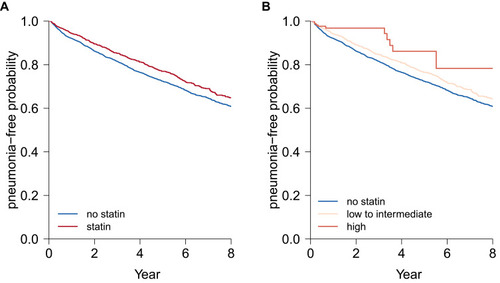
Table 4 Risk of Poststroke Pneumonia According to Statin Intensity