
Figures & data
Table 1 Primer Sequences Used for qPCR Analysis
Figure 1 LEfSe Analysis of Change in Number of Hits from T0 to T1. Each column represents a different AMR gene that demonstrated a significant change (change in linear determinant analysis [LDA] of ≥2) in the number of hits from the T0 collection point (screening) to the T1 collection point (post-antibiotics). Top figure, placebo group and bottom figure, ribaxamase group. Red bars decreased significantly between these collection points while green bars increased significantly. Specific gene classes of interest are indicated by colors on the figure, blue β-lactamases, green vancomycin resistance genes and red efflux pump genes. Individual gene notations correspond to the Comprehensive Antimicrobial Resistance Database.
![Figure 1 LEfSe Analysis of Change in Number of Hits from T0 to T1. Each column represents a different AMR gene that demonstrated a significant change (change in linear determinant analysis [LDA] of ≥2) in the number of hits from the T0 collection point (screening) to the T1 collection point (post-antibiotics). Top figure, placebo group and bottom figure, ribaxamase group. Red bars decreased significantly between these collection points while green bars increased significantly. Specific gene classes of interest are indicated by colors on the figure, blue β-lactamases, green vancomycin resistance genes and red efflux pump genes. Individual gene notations correspond to the Comprehensive Antimicrobial Resistance Database.](/cms/asset/64ffc8cf-ee96-40a8-a483-8cfb018a2dfb/didr_a_260258_f0001_c.jpg)
Figure 2 Comparing Number of Hits per Sample vs Copy Number per Sample. The graph compares data quartiles for the number of hits per sample with the copy number of the gene for each sample for, (A) cfxA and (B) vanRD. The data were separated into quartiles for the 100 samples that were subjected to qPCR analysis and compares the number of hits per sample, as determined by database alignment, vs the copy number per sample, as determined by qPCR analysis. The quartiles were as follows, cfxA Hits, Q1: 0–2658, Q2: 2659–52,776, Q3: 52,777–175,384, Q4: >175,384; Copy Number, Q1: 0–62, Q2: 63–410, Q3: 411–1244, Q4: >1244, vanRD Hits, Q1 & Q2 = 0, Q3: 1–33, Q4: >33, Copy Number, Q1 & Q2 = 0, Q3: 1–4, Q4: >4. Quartiles 1 and 2 were combined for both parameters on the figure for vanRD due to the abundance of samples with zero values in the sample set. The size of each sphere represents the number of samples, based on the copy number, which corresponded to the indicated quartile for hits. The red lines are added for emphasis.
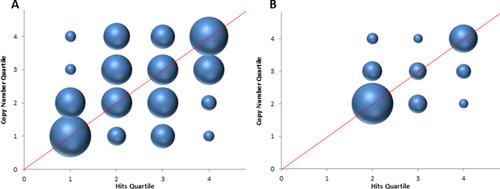
Table 2 Comparison of the Frequency of Antibiotic Resistance Genes at T0 vs T1 in the Ribaxamase vs Placebo-Treated Patients
Table 3 Change in Mean Copy Number Over Time for cfxA and vanRD in Placebo vs Ribaxamase-Treated Patients
Table 4 β-Lactamase Gene Variants Demonstrating a Significant Increase in Placebo vs Ribaxamase-Treated Patients from T0 to T1
Table 5 β-Lactamase Gene Variants Demonstrating a Significant Increase in Hits with PPI-Use or Non-Use from T0 to T1
Table 6 Vancomycin Resistance Genes Demonstrating a Significant Increase in Placebo vs Ribaxamase-Treated Patients from T0 to T1