Figures & data
Table 1 Patients Characteristics of 2636 AB Clinical Isolates from 2012 to 2019
Table 2 Antimicrobial Susceptibility of AB Clinical Isolates Obtained from Patients at a Hospital Center in China,2012–2019
Table 3 Antimicrobial Resistance of AB Clinical Isolates
Figure 1 Antimicrobial resistance of AB clinical isolates obtained from patients at a hospital center in China, 2012–2019.
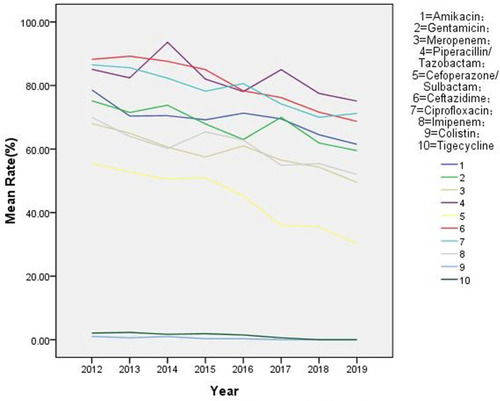
Table 4 Antimicrobial Susceptibility of AB Clinical Isolates
Figure 2 Antimicrobial susceptibility of AB clinical isolates obtained from patients at a hospital center in China, 2012–2019.
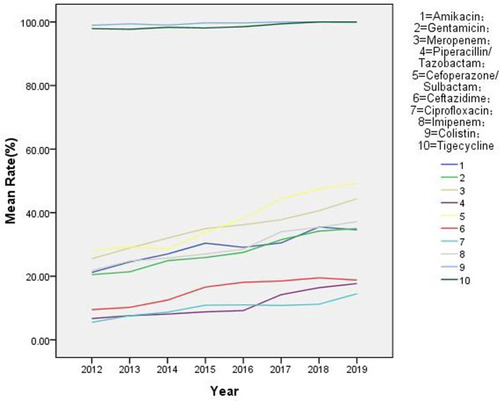
Table 5 DDD, ABHG and the Rate of MDR-AB,XDR-AB and NIAB-ICU from 2012 to 2019
Figure 3 The trends of MDR-AB rate, XDR-AB rate and NIAB-ICU rate from 2012 to 2019.
Abbreviations: AMS, antimicrobial stewardship; ICP, infection control programs; ENC, environmental cleaning; NIAB-ICU, nosocomial infection of acinetobacter baumannii in ICU.

Table 6 The Correlation of Isolation Rates of MDR-AB with Consumption of Antimicrobial Agents and ABHG
Table 7 The Correlation of Isolation Rates of XDR-AB with Consumption of Antimicrobial Agents and ABHG
Table 8 The Correlation of Rates of NIAB-ICU with Consumption of Antimicrobial Agents and ABHG
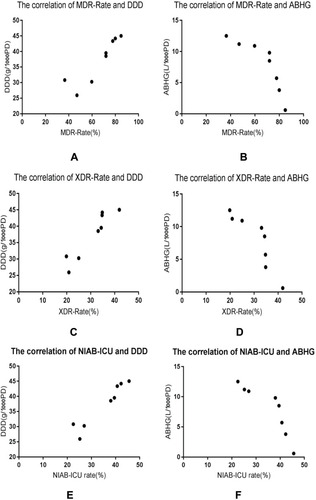
Figure 4 The correlations of isolation rates of MDR-AB, XDR-AB and NIAB-ICU with DDD and ABHG.