
Figures & data
Table 1 Minimum Bactericidal Concentration (MBC) of Antibiotics When Tested in Combination with SMs
Table 2 Minimum Bactericidal Concentration (MBC) of SMs When Tested with Antibiotics
Table 3 Minimum Bactericidal Concentration (MBC) of Colistin Against APEC O1 and O2 When Tested with Selected SMs
Figure 1 (A) Survival curve of wax moth larvae treated with colistin alone or in combination with SMs. Larvae (n=15 larva/group) were infected with 6.4×10⁴ CFU of Rifr APEC O78 and then treated with colistin (0.3125 mg/kg) and combination of colistin and SMs (0.3125 mg/kg+12.5 µg) within 30 min of infection. Larval survival was monitored every 12 h for 3 days. (B) APEC load inside wax moth larvae treated with colistin alone or in combination with SMs. APEC load in larvae was quantified by plating the homogenized larval suspension on MacConkey agar plates supplemented with 50 µg/mL rifampicin. PC-infected and buffer mix (DMSO+PBS) treated larvae, ***P<0.0001.
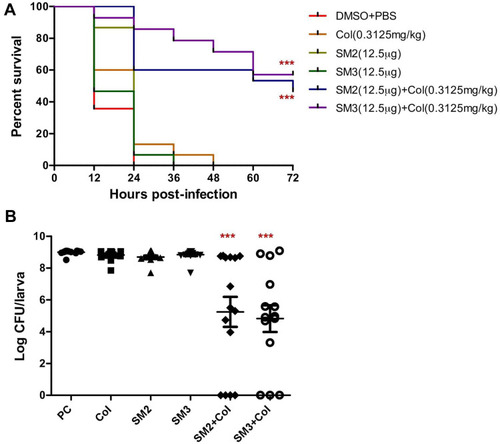
Figure 2 (A) Minimum inhibitory concentration (MIC) of APEC cultures passaged only in presence of colistin or in combination with SMs. Six parallel independent APEC cultures (Col 1–6, Col + SM2 1–6, and Col+ SM3 1–6) were serially passaged (8 passages) in M63 media starting with the sub-inhibitory concentration of colistin (0.0625 µg/mL) to up to 8 µg/mL (beyond resistance breakpoint) in presence and absence of 0.5× MIC of SMs. APEC cultures containing no colistin and no SM (1% DMSO; DMSO 1–6) were used as controls and passaged similarly to cultures containing colistin or colistin and SMs. The black dotted line indicates the MIC breakpoint for colistin resistance. (B) Chemical structure and ChemBridge ID of selected SMs.
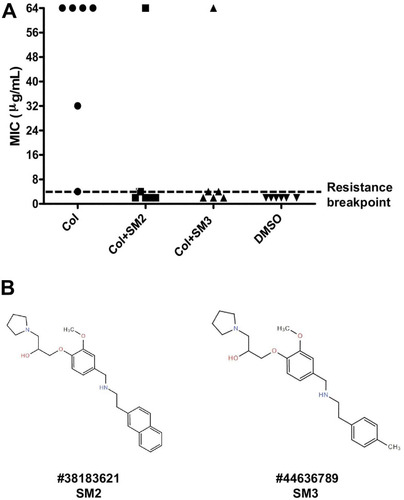
Table 4 Mutations Observed in ColR APEC Isolates Analyzed Using PointFinder Database
Table 5 Non-Synonymous Mutations Observed in ColR APEC Isolates
Figure 3 Heatmap displaying the non-synonymous mutational comparison between ColR isolates (Col-1, Col-3, Col-5, Col-6, Col + SM2-2 and Col + SM3-5) as compared to ColS (DMSO-1, DMSO-3, Col + SM2-4, Col + SM2-6, Col + SM3-2 and Col + SM3-6) isolates. Phenotype “R” indicates resistant APEC isolate and “S” indicates susceptible APEC isolate.
Abbreviation: NA, not available.
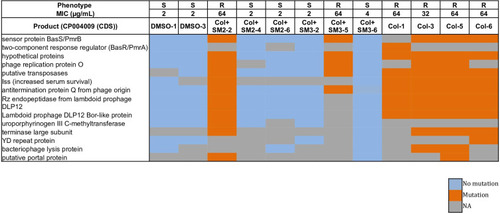
Figure 4 (A) Expression (fold change) of pmrC and pmrH in APEC isolates passaged with colistin alone (Col-1, Col-3, Col-5 and Col-6), colistin and SM2 (Col + SM2-2, Col + SM2-4 and Col + SM2-6), and colistin and SM3 (Col + SM3-2, Col + SM3-5 and Col + SM3-6) as compared to control (DMSO-1 and DMSO-3) isolates. (B) Expression (fold change) of pmrA and pmrB in APEC isolates passaged with colistin alone (Col-1, Col-3, Col-5 and Col-6), colistin and SM2 (Col + SM2-2, Col + SM2-4 and Col + SM2-6), and colistin and SM3 (Col + SM3-2, Col + SM3-5 and Col + SM3-6) as compared to control (DMSO-1 and DMSO-3) isolates. Phenotype “R” indicates resistant APEC isolate and “S” indicates susceptible APEC isolate.
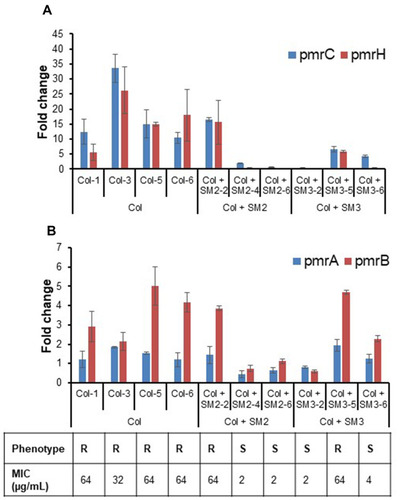
Table 6 Summary of Colistin Adjuvants Tested Against Different Pathogenic Bacteria
Table 7 Summary of pmrB and pmrA Mutations Reported in ColR E. coli