Figures & data
Figure 1 The study design flow chart.
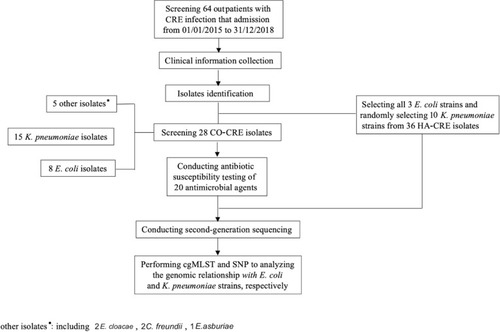
Table 1 Overview of Clinical Characters and Antimicrobial Resistance Genes of 28 Patients with Community-Onset CRE Infections
Table 2 Comparisons of Clinical Characters Among CA-CRE, HCA-CRE, and HA-CREa with All 64 CRE Cases
Figure 2 (A) Antibiotic-resistance rate comparisons of 9 community-acquired K. pneumoniae (CA-KP) and 6 healthcare-associated K. pneumoniae (HCA-KP) isolates to 20 common agents, with no significant difference (P>0.05). The red dotted line provides a reference with a rate of 50%. (B) Antibiotic-resistance rate comparisons of 5 community-acquired E. coli (CA-EC) and 6 healthcare-associated E. coli (HCA-EC) isolates to 20 common agents, with no significant difference (P>0.05). The red dotted line provides a reference with a rate of 50%. (C) Nonsusceptible rate comparisons of 15 community-onset K. pneumoniae (CO-KP) and 8 community-onset E. coli (CO-EC) isolates to 20 common agents. The significant P-value is marked above the bar chart (P<0.05). The red dotted line provides a reference with a rate of 50%.
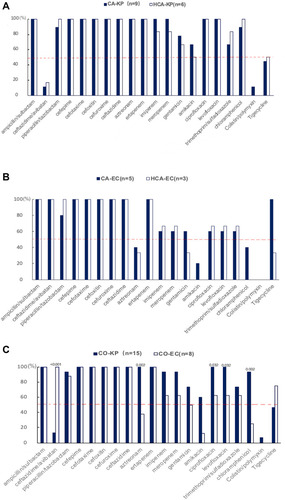
Figure 3 (A) Minimum spanning tree of core genome sequences of K. pneumoniae collected from 2015~2018 (n = 25, 15CO-KP and 10HA-KP). The cluster distance threshold is 15 alleles. Each circle (node) represents one or multiple identical sequences. The number between the nodes illustrates the number of target genes with different alleles. The text in each circle indicates the case identifier. The sequence types were labeled above the circles. (B) Minimum spanning tree of core genome sequences of E. coli collected from 2015~2018 (n =11, 8 CO-EC and 3 HA-EC). The cluster distance threshold is 10 alleles. Each circle (node) represents one or multiple identical sequences. The number between the nodes illustrates the number of target genes with different alleles. The text in each circle indicates the case identifier.
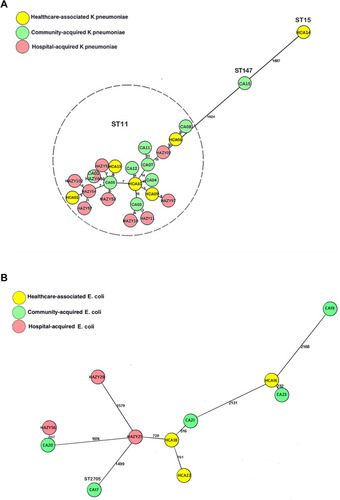
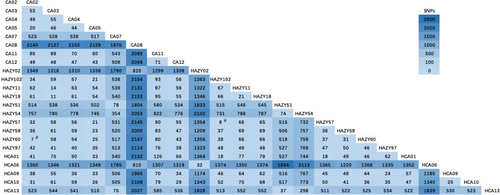
Figure 4 The number of single-nucleotide polymorphisms (SNPs) between each ST11 K. pneumoniae strain heatmap. The deeper the color is, the larger the SNP quantity scale. # indicates core genome SNP differences ≤10.