Figures & data
Table 1 The Interaction Between Pseudolaric Acid B and Fluconazole Against Isolates of C. tropicalis in vitro
Figure 1 The Growth curve of PAB in combination with FLC against resistant C. tropicalis (365). The fungal supernatant (103 CFU/mL) containing agents (1 µg/mL PAB, 2 µg/mL FLC and 1µg/mL PAB + 2µg/mL FLC) were grown with constant shaking at 37◦C. The control was free of FLC and PAB. At designated time points (0, 12, 24, 48 h), the cell broths were pipetted out to determine the OD with microplate reader at 495 nm.
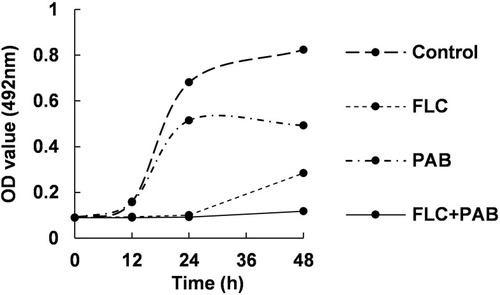
Figure 2 The growth condition of C. tropicalis (365) treated with PAB alone and in combination with FLC (40x). At 48h of Growth curve assay, 20 μL of cell broths were filled into the fast counting plate to observe the growth state of strains with microscope. (A). The control was free of FLC and PAB; (B–D). Yeast cells respectively treated with 2 µg/mL FLC,1µg/mL PAB and 1µg/mL PAB + 2µg/mL FLC.
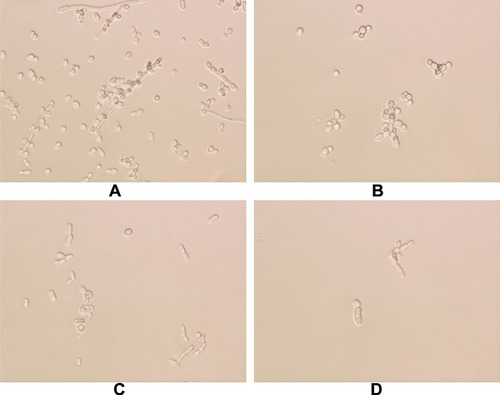
Figure 3 Effects of FLC/PAB alone on biofilm formation at different stages. (A) The inhibition of FLC alone against biofilm formation. (B) The inhibition of PAB alone against biofilm formation. 0, 2, 6 and 24 h represent the time point of starting to add drug intervention in the process of biofilm formation. Early biofilm (0h): C. tropicalis cells were incubated continuously in the presence of FLC/PAB at 37°C for 48 h. Early biofilm (2h): C. tropicalis cells were allowed to adhere for 2 h then FLC/PAB was added and incubated further for 48 h. Developmental biofilm (6h): C. tropicalis cells grew for 6 hours to form metaphase biofilm, and then FLC/PAB was added to incubate further for 48 h. Mature biofilm (24h): After growing for 24 hours to form mature biofilm, C. tropicalis cells were treated with FLC/PAB for another 24 h. (C) The control group was free of antifungal agents, accepted as 0% inhibition. *p < 0.05, compared with the control.
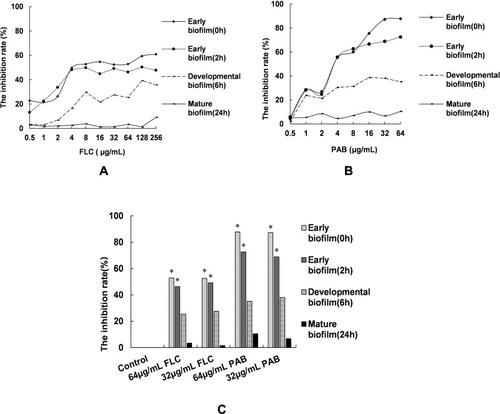
Figure 4 Effects of PAB and FLC combination on biofilm formation. (A) Early biofilm (0h): C. tropicalis cells were incubated continuously in the presence of FLC+PAB at 37°C for 48 h. (B) Early biofilm (2h): C. tropicalis cells were allowed to adhere for 2 h then FLC+PAB was added and incubated further for 48 h. (C) Developmental biofilm (6h): C. tropicalis cells grew for 6 hours to form metaphase biofilm, and then FLC+PAB was added to incubate further for 48 h. (D) Mature biofilm (24h): After growing for 24 hours to form mature biofilm, C. tropicalis cells were treated with FLC+PAB for another 24 h. Abscissa refers to the concentration of FLC. Each curve shows the trend of biofilm inhibition with the increase of FLC concentration, when PAB is at a specific concentration. (E) Inhibition of biofilm formation at 16 µg/mL FLC, 4 µg/mL PAB, 16 µg/mL FLC+4 µg/mL PAB. *p < 0.05, compared with the combination group (16 µg/mL FLC+4 µg/mL PAB).
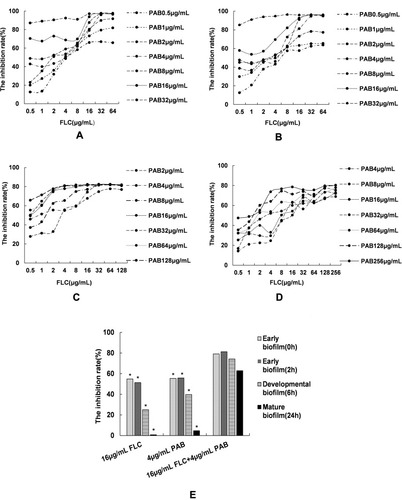
Figure 5 The fluorescence microscope assay of PAB in combination with FLC against biofilm (10x). (A) The control (without FLC and PAB); (B) 16 µg/mL FLC; (C) 4 µg/mL PAB; (D) 4µg/mL PAB + 16µg/mL FLC.
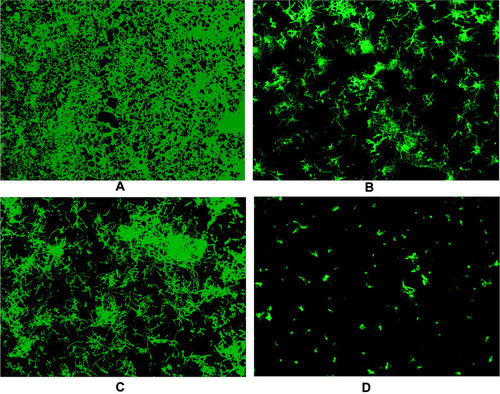
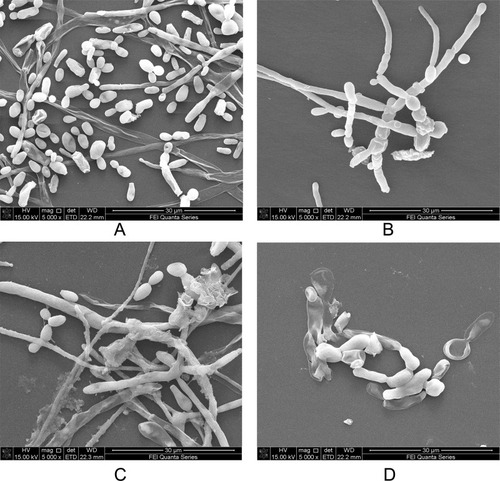
Figure 6 The scanning electron micrographs of PAB in combination with FLC against biofilm (5000x). (A) The control (without FLC and PAB); (B) 16 µg/mL FLC; (C) 4 µg/mL PAB; (D) 4µg/mL PAB + 16µg/mL FLC.