Figures & data
Figure 1 The chemical structures of tested CSAs.
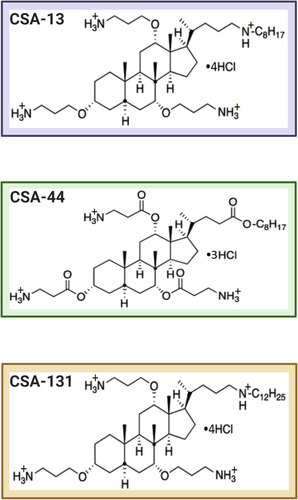
Table 1 MIC and MBC Values of CSA-13, CSA-44, CSA-131, and Antibiotics/Chemotherapeutics Tested Against Escherichia coli BAA 2471, Enterobacter cloacae BAA 2468, Klebsiella pneumoniae subsp. pneumoniae BAA 2472, and Klebsiella pneumoniae BAA 2473
Figure 2 Bactericidal activity of CSA-13 (black squares), CSA-44 (red circles), and CSA-131 (blue triangles) against Escherichia coli BAA 2471 (A), Enterobacter cloacae BAA 2468 (B), Klebsiella pneumoniae subsp. pneumoniae BAA 2472 (C), and Klebsiella pneumoniae BAA 2473 (D). Killing activities of CSAs studied at 1–100 µg/mL was determined using a standard colony counting assay. Results show mean±SD from six measurements. * indicates statistical significance at ≤0.05, ** ≤0.01, and *** ≤0.001.
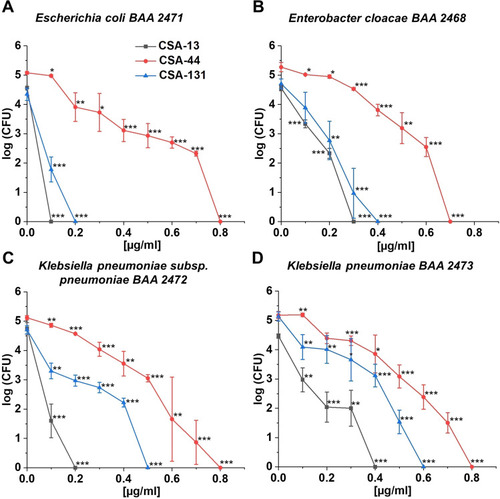
Figure 3 Prevention of biofilm formation by Escherichia coli BAA 2471 (A), Enterobacter cloacae BAA 2468 (B), Klebsiella pneumoniae subsp. pneumoniae BAA 2472 (C), and Klebsiella pneumoniae BAA 2473 (D) during treatment with CSA-13, CSA-44, and CSA-131 compounds. Formation of biofilm in the presence of CSAs ranging from 1–100 μg/mL was assessed using the resazurin-based fluorimetric method after 24, 48, and 72 hours incubation. Results show mean±SD from 3–6 measurements. * indicates statistical significance ≤0.05, ** ≤0.01, and *** ≤0.001.
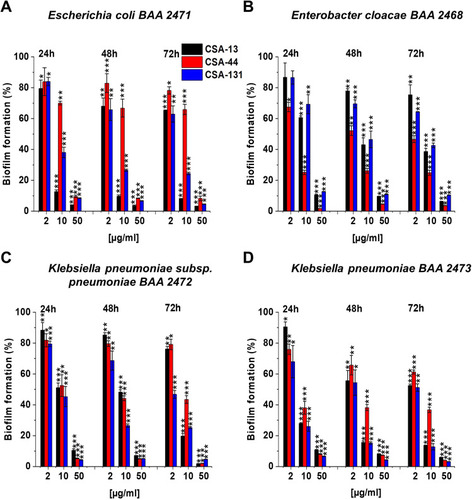
Figure 4 Disruption of the biofilms formed by Escherichia coli BAA 2471 (A–C), Enterobacter cloacae BAA 2468 (D–F), Klebsiella pneumoniae subsp. pneumoniae BAA 2472 (G–I), and Klebsiella pneumoniae BAA 2473 (J–L) using CSA-13, CSA-44, and CSA-131 compounds. Reduction of the biofilm formed at 24, 48, and 72 hours incubation with CSAs in concentration of 1–100 µg/mL was performed using killing assay method. Results show mean±SD from 3–6 measurements. * indicates statistical significance ≤0.05, ** ≤0.01, and *** ≤0.001.
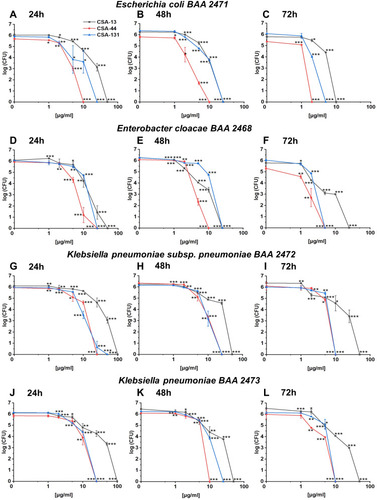
Figure 5 Disruption of the outer membrane of Escherichia coli BAA 2471 (A), Enterobacter cloacae BAA 2468 (B), Klebsiella pneumoniae subsp. pneumoniae BAA 2472 (C), and Klebsiella pneumoniae BAA 2473 (D) upon treatment with CSA-13, CSA-44, and CSA-131 at doses of 1–10 μg/mL was investigated using NPN uptake assay. Results show mean±SD, n=3; * indicates statistical significance ≤0.05, ** ≤0.01, and *** ≤0.001.
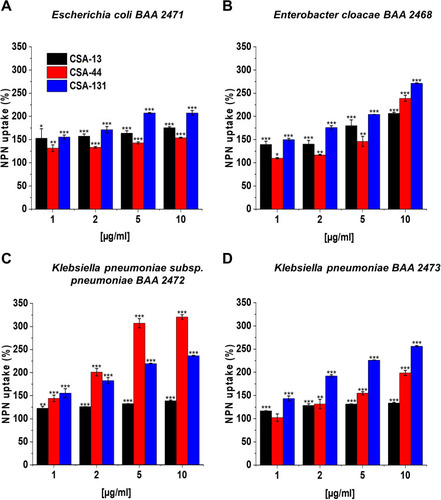
Figure 6 Permeability of the inner bacterial membrane of Escherichia coli BAA 2471 (A), Enterobacter cloacae BAA 2468 (B), Klebsiella pneumoniae subsp. pneumoniae BAA 2472 (C), and Klebsiella pneumoniae BAA 2473 (D) was assessed using ONPG hydrolysis assay. The insertion of CSA-13, CSA-44, and CSA-131 ranging 1–10 μg/mL into the bacterial membrane was monitored by the enhancement of β-galactosidase activity. Results show: mean±SD, n=3; * indicates statistical significance ≤0.05, ** ≤0.01, and *** ≤0.001.
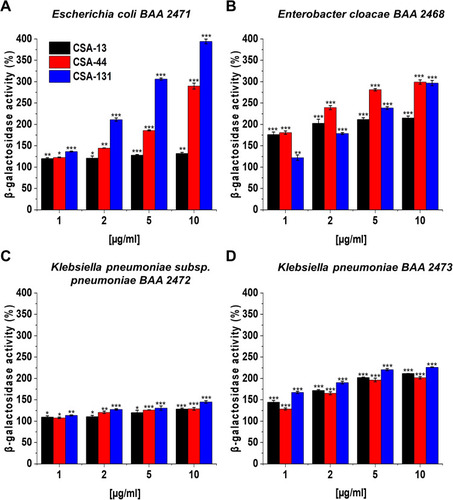
Figure 7 Induction of reactive oxygen species (ROS) generation by Escherichia coli BAA 2471 (A), Enterobacter cloacae BAA 2468 (B), Klebsiella pneumoniae subsp. pneumoniae BAA 2472 (C), and Klebsiella pneumoniae BAA 2473 (D) was evaluated by DFCH-DA fluorimetric assay. Formation of ROS upon treatment with CSA-13, CSA-44, and CSA-131 at a concentration of 1–10 μg/mL was presented. Results show: mean±SD, n=3; * indicates statistical significance ≤0.05, ** ≤0.01, and *** ≤0.001.
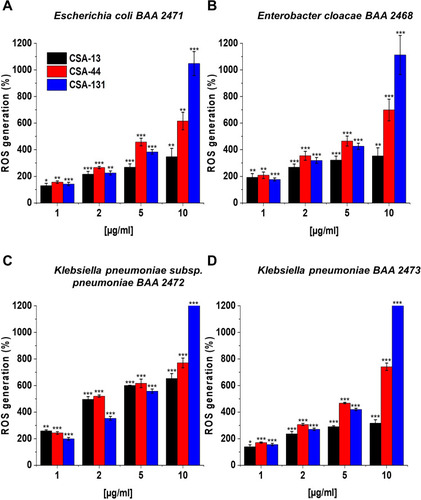
Figure 8 Schematic model of mechanical properties of AFM.
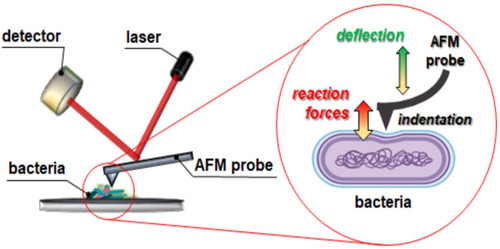
Figure 9 Atomic force microscopy measurements of Klebsiella pneumoniae BAA-2473 cells subjected to ceragenin CSA-13, CSA-44, and CSA-131 treatment. Examination of AFM topography and visualization of stiffness and adhesion indicate that all CSAs affect the morphology, mechanical, and adhesive properties of Klebsiella pneumoniae BAA-2473. The left column of panels (in both control and CSA-13, CSA-44, and CSA-131 sectors) shows the height mode (topography), the middle column shows the slope mode (stiffness), and the right column is represented by the adhesion mode (forces between the cells and the AFM probe). The mean values of slope and adhesion (plus standard deviation) are presented in the tables.
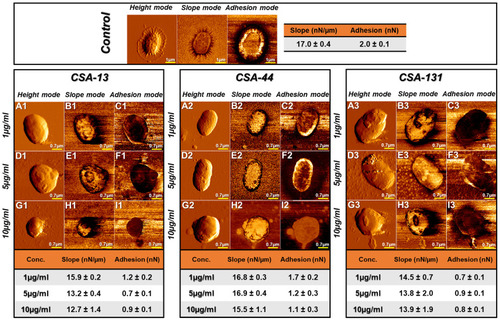
Figure 10 Hemoglobin release from human red blood cells (RBCs) after 1, 6, and 12 hours incubation in the presence of CSA-13 (A), CSA-44 (B), and CSA-131 (C) ranging from 1–100 μg/mL. Results show: mean±SD, n=3; * indicates statistical significance ≤0.05, ** ≤0.01, and *** ≤0.001.
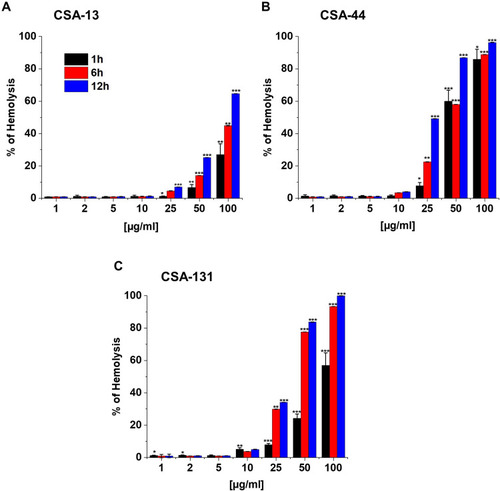
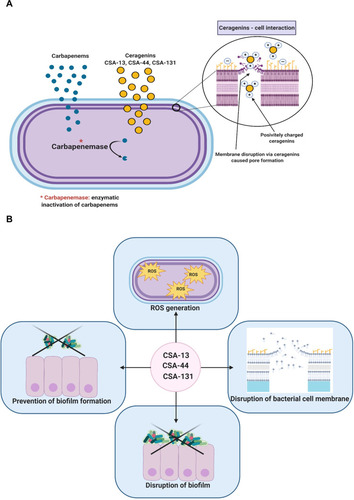
Figure 11 Mechanism of carbapenem resistance among bacteria belonging to Enterobacteriaceae family. Proposed mechanism of action which involves selective association with microbial membranes, mediated by ion pairing of positively charged CSAs with negatively charged microbial membranes (A). The pleiotropic activity of CSA-13, CSA-44, and CSA-131 (B). The figure was prepared using BioRender.