Figures & data
Table 1 Primer Pair Sequences for qRT-PCR
Figure 1 Cell viability and proliferation. The Live/Dead staining of BMSCs cultured without antibiotics on the 7 days (A); The Live/Dead staining of BMSCs cultured with vancomycin (B), tobramycin (C), and combination of vancomycin-tobramycin (D) on the 7 days (scale bars, 50μm). The quantitative results of the Live/Dead assay (E). Quantitative analysis of BMSCs proliferation rate by CCK-8 assay over 7 days (F).
Abbreviations: Con, control; Van, vancomycin; Tob, tobramycin.
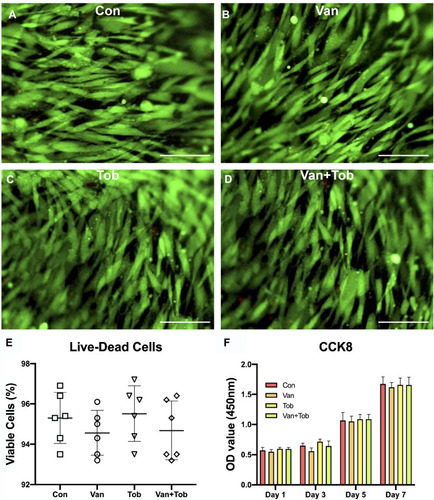
Figure 2 The effect of vancomycin and tobramycin on mineralization of BMSCs was assessed by ARS and ALP staining. BMSCs were stained with ARS and ALP after cultured 14 and 21 days, respectively. ARS staining (A) and its quantification (B) in the Con, Van, Tob, and Van+Tob groups. ALP staining (C) and its quantitative analysis (D) in the four groups. *p < 0.05, **p < 0.01, ***p < 0.001.
Abbreviations: Con, control; Van, vancomycin; Tob, tobramycin.
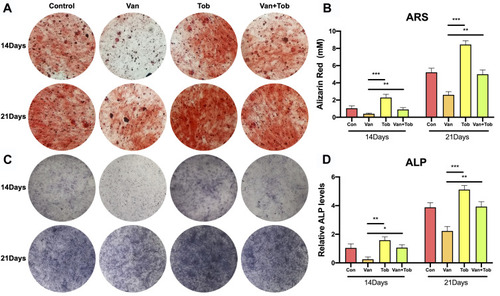
Figure 3 Antibiotics affect the migration of BMSCs. In vitro scratch assays were used to analyzed the migration rate of BMSCs with different antibiotics within 24 hours (A). Statistical analysis of scratch assay (B). **p < 0.01, ***p < 0.001.
Abbreviations: Con, control; Van, vancomycin; Tob, tobramycin.
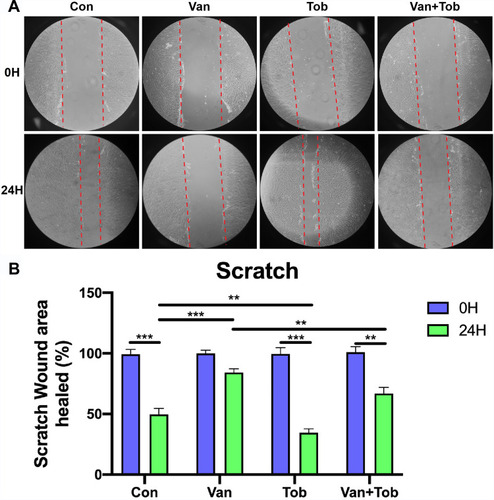
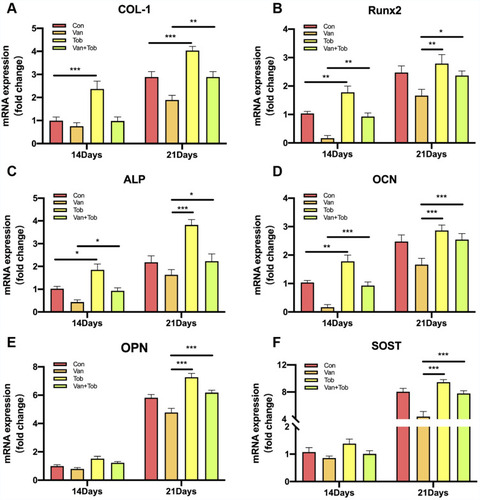
Figure 4 Real-time PCR assay was applied to evaluate the expression of osteogenic mRNA. The osteogenic mRNA expression of Col-1 (A), Runx2 (B), ALP (C), OCN (D), OPN (E), SOST (F) in BMSCs was quantified by real-time PCR after 14 and 21 days of incubation. *p < 0.05, **p < 0.01, ***p < 0.001.
Abbreviations: Con, control; Van, vancomycin; Tob, tobramycin.