Figures & data
Figure 1 Gender and age distribution of K. pneumonia-positive and -negative UTI patients. Frequency distribution of urine culture with K. pneumonia positive (+ve) and negative (-ve) according to sex (male and female) and age group (1–20 YO, 21–40 YO and more than 40 YO) (n=142, Years Old = YO).
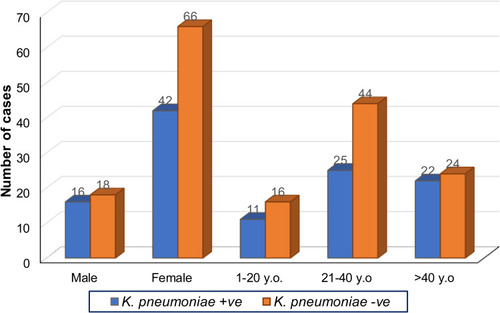
Figure 2 Impact of Extended Spectrum β-lactamase (ESBL) genes on the phenotypic susceptibilities of β-lactam antibiotics. The comparative susceptibilities of the ESBL-positive and -negative isolates were evaluated against selected b-lactam antibiotics, namely Amoxycillin+Clavulinic acid (AMC 30 µg), Cefepime (FEP 30 µg), Cefuroxime Sodium (CXM 30 µg), Cephalexin (CL 30 µg), Ceftriaxone (CRO 30 µg), Imipenem (IMP 10 µg). (A). The Y-axis values of black bars indicate the percentage of ESBL gene-carrying isolates showing as susceptible against respective antibiotics shown on the X-axis. Similarly, the white bars illustrate the percentages of susceptible isolates that do not carry the respective ESBL genes. Susceptibilities of (A) blaKPC-positive (n=9) and -negative (n=49), (B) blaIMP-positive (n=6) and -negative (n=52), (C) blaVIM-positive (n=11) and -negative (n=47), and (D) blaNDM1-positive (n=13) and -negative (n=45), isolates are shown separately.
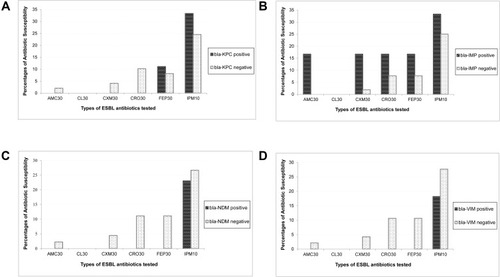
Table 1 Association Between Phenotypic Antimicrobial Susceptibility of Urine K. Pneumoniae with Age and Sex (Fisher’s Exact Test, n=58)
Table 2 Association Between Genotypic blaKPC, blaIMP, blaNDM-1, and blaVIM of Urine K. Pneumoniae with Age and Sex (Fisher’s Exact Test, n=58)
Table 3 Phenotypic Antibiotic-Resistance of Bacterial Isolates Carrying Single-Type versus Combined-Types ESBLa Genes
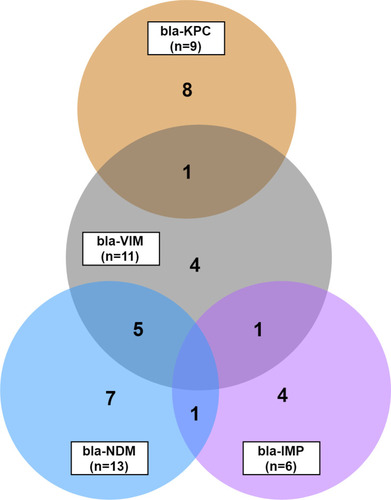
Figure 3 Overlapping Extended Spectrum β-lactamase (ESBL) genes. The Venn-diagram shows the mutual prevalence of ESBL genes, such as blaKPC, blaIMP, blaVIM, and blaNDM-1 in the uropathogen Klebsiella pneumoniae. Each circle is labeled with the respective gene-name, and the number in the bracket indicates the total count of isolates positive for the specific gene. Numbers in the non-overlapping region show the count of isolates carrying respective single-type ESBL genes. Numerates in the overlapping region indicate the isolate number carrying the respective genes mutually.