Figures & data
Table 1 The Oligonucleotide Primers Used in the RIF-RD and INH-RD Assays
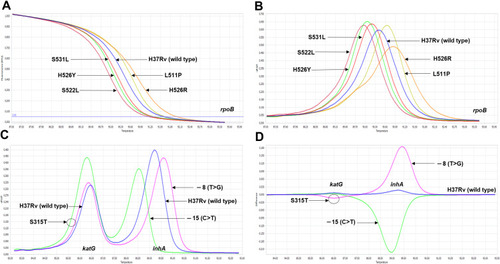
Figure 1 The differentiation between phenotypically drug-resistant and -susceptible M. tuberculosis clinical strains by the optimized RIF-RD (A and B) and INH-RD (C and D) assays using M. tuberculosis H37Rv as the reference (blue line): the normalized melting curve (A and C) and the normalized melting peak (B and D).
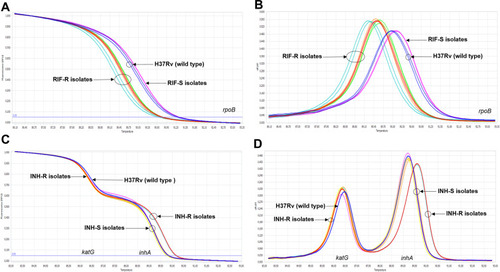
Figure 2 The ROC curve of rpoB (A), katG (B), and inhA promoter (C) applied for determining the ∆Tm cutoff to detect RIF and INH resistance in M. tuberculosis isolates.
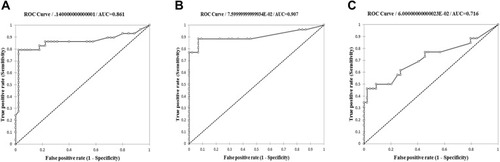
Table 2 The Distribution of the rpoB, katG, and inhA Genotypes Among 30 MDR-TB Isolates in Northern Thailand
Figure 3 The differentiation among various mutation profiles observed in rpoB, katG and inhA promoter by the optimized RIF-RD (A and B) and INH-RD (C and D) assays using M. tuberculosis H37Rv as the reference (blue line): the normalized melting curve (A and C) and the normalized melting peak (B and D).