Figures & data
Table 1 Comparison of T-lymphocyte Subtypes, Humoral Immunity, and Cytokines Between Severe and Nonsevere Groups
Table 2 Univariate and Multivariate Analysis Associated with In-Hospital Severity Progression of Patients with mNCP
Figure 1 Nomogram of the mNCP-SPI. A score of 165 was considered the cutoff.
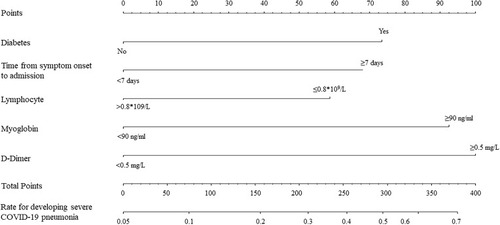
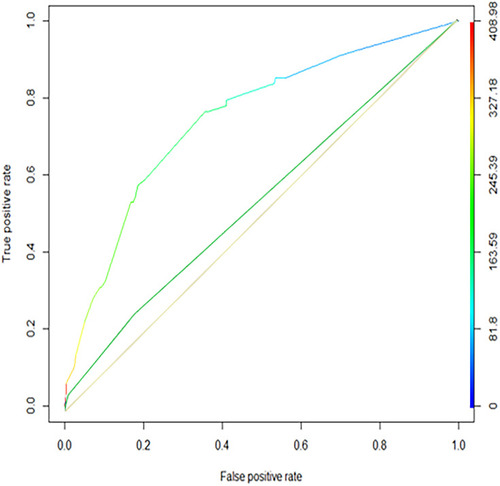
Figure 2 ROC curve and comparison between mNCP-SPI and CURB-65 scores on admission. This model showed c-statistics for the mNCP-SPI of 0.747, with sensitivity and specificity 0.764 and 0.644, respectively, under the cutoff of 165. Different levels of the mNCP-SPI are shown by color: blue the lowest and red the highest. The ROC curve of CURB-65 is presented in green, and the reference line of 0.5 is yellow.