Figures & data
Table 1 The Comparison of Antibiotic Resistance Profile Between the Integron Positive and Negative Clinical Isolates of Pseudomonas aeruginosa
Table 2 The Comparison of Resistance Percent Rates Against 13 Tested Antibiotics Among the MDR and Non-MDR Isolates of Pseudomonas aeruginosa
Table 3 The Prevalence of Different Resistance Gene Cassette Arrays in the Clinical Isolates of Pseudomonas aeruginosa and Their Correlation with the Resistance Towards Tested Antibiotics
Table 4 Prevalence of MDR and Integron Positive Pseudomonas aeruginosa Clinical Isolates Based on the Source of Isolation
Figure 1 The number of integron positive and MDR Pseudomonas aeruginosa clinical isolates according to the hospital sources.
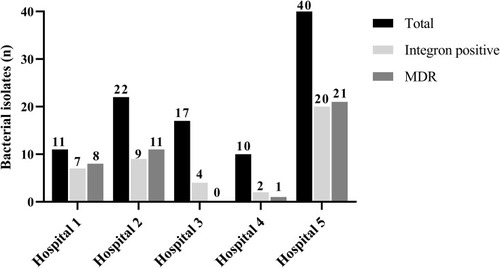
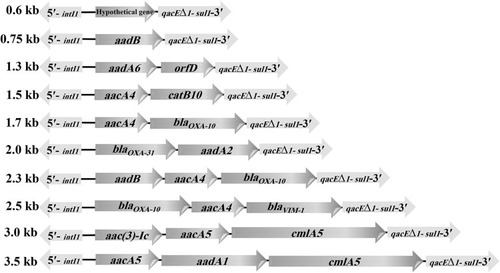
Figure 2 The size and structure of resistance gene cassettes between two conserved ends (5′CS and 3′CS) of the class 1 integrons detected in the clinical isolates of Pseudomonas aeruginosa.