Figures & data
Figure 1 Western blot analysis of ferritin-binding proteins in S. pneumoniae. 1, protein marker; 2, plasma sample with 3 ferritin-binding proteins in ~30, 58 and 114 KDa ranges; 3, serum sample without any positive reaction; 4, a negative reaction with proteins concentrated from supernatant of S.pneumoniae culture; 5, a negative reaction with proteins from sediment of S.pneumoniae culture; 6, a negative reaction with reduced and denatured proteins concentrated from supernatant of S.pneumoniae culture; 7, a negative reaction with reduced and denatured proteins purified from sediment of S.pneumoniae culture.
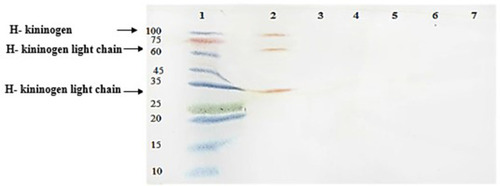
Figure 2 The levels of ferritin in the SBHI, SBHI + S. pneumoniae, SBHI + PMSF and SBHI + S. pneumoniae + PMSF groups.
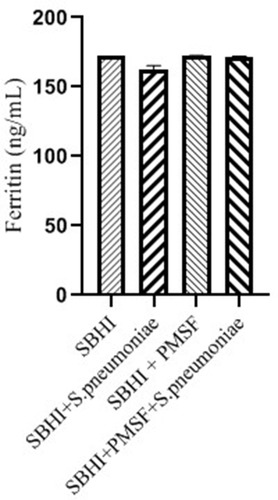
Figure 3 The levels of transferrin in the in the SBHI, SBHI + S. pneumoniae, SBHI + PMSF and SBHI + S. pneumoniae + PMSF groups.
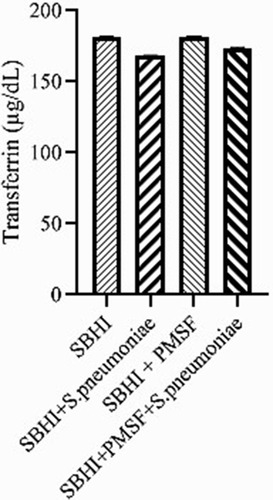
Figure 4 The levels of iron in the in the SBHI, SBHI + S. pneumoniae, SBHI + PMSF and SBHI + S. pneumoniae + PMSF groups.
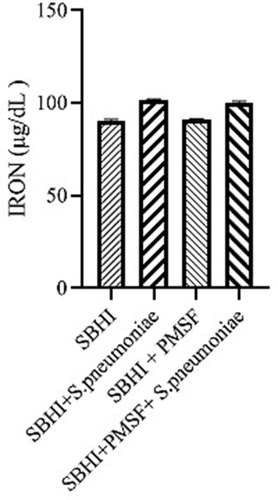
Figure 5 Interactions between PMSF and HtrA protease. Stearic bonds between HtrA protease and PMSF at histidine 73 and isoleucine 109 positions were predicted.
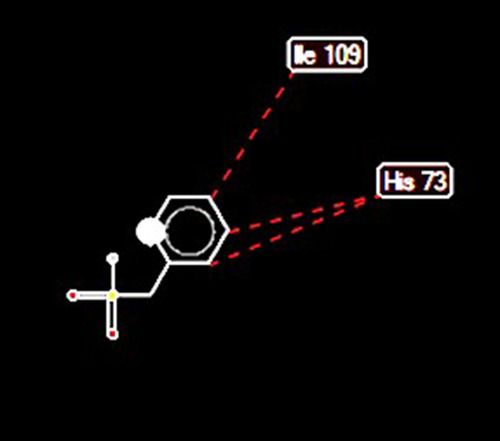
Figure 6 Docking between PMSF and ClpP protease indicated possible hydrogen bonds (length of 2.6 A) at arginine 14 and methionine 1 positions.
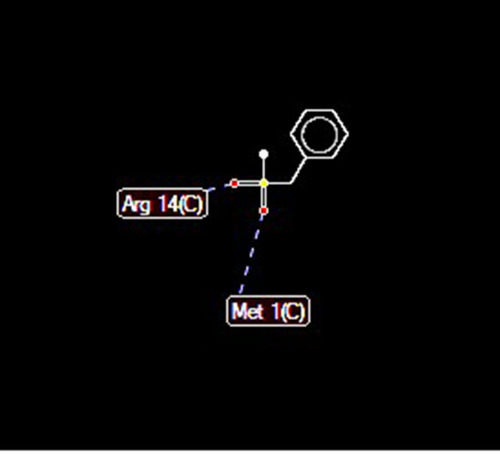
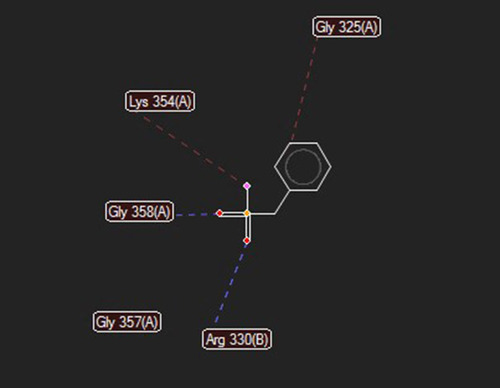
Figure 7 Docking between PMSF and RadA protease domain predicted hydrogen bonds at glycine 358 (length: 2.62737 A) and arginine 330 (length: 3.11448 A), and stearic bonds at glycine 325, lysine 354, and glycine 357 positions.