Figures & data
Table 1 The Final Immunodominant Epitopes Were Selected from S, M, N, and E Proteins of SARS-CoV-2
Figure 1 Schematic representation of the designed multi-epitope peptide based-vaccine. The vaccine consist of ten parts: Epitopes from structural proteins S, E, N, and M, adjuvants: Flagellin (in N-and C-terminus), HP-91 and HBD-3 that join to each other by linkers of repeat sequence of LE (A). Tertiary structure of the modeled multi-epitope vaccine construct (B). The 3D structure of the designed vaccine was predicted via homology modeling by Phyre2, then the best-predicted model was refined by Galaxy Refine and visualized using Discovery studio 4.5 software. N-and C-terminus of Flagellin is shown in green, HP-91 in gray, S epitopes in blue, E epitopes in red, N epitope in purple, M epitope in orange, HBD-3 in green, and linkers are shown in light pink.
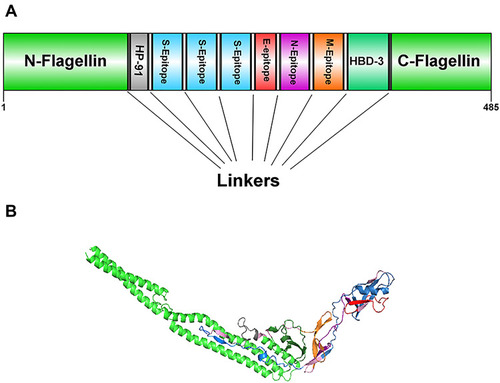
Table 2 Analysis of the Physicochemical and Immunological Properties of the SARS-CoV-2 Vaccine
Table 3 Conformational B-Cell Epitopes Identified in the Refined Tertiary Structure of the Multi-Epitope Vaccine Using ElliPro
Figure 2 Docking model (cartoon representation) of human TLR3 in complex with the vaccine obtained using Cluspro server. TLR3 protein is shown in chocolate and vaccine was colored from N-to C-terminals (N-flagellin is shown in blue and C-flagellin is shown in red). As it shows some parts of two S, M, N, and E epitopes, HBD-3, and HP-91 interacted with TLR3. To more visualized interaction points, some of the interacting residues of the vaccine and TLR3 are magnified in 20 Angstrom. Docked model was visualized via Discovery studio 4.5 software.
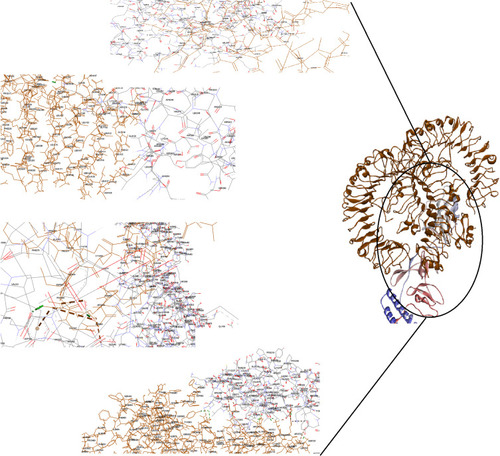
Figure 3 Docking model (cartoon representation) of human TLR5 in complex with the vaccine obtained using Cluspro server. TLR5 is shown in chocolate and vaccine was colored from N-to C-terminals (N-flagellin is shown in blue and C-flagellin is shown in red). As the figure shows some parts of Flagellin, S-epitope and HP-91 interacted with TLR5. In order to more visualized interaction points, some of the interacting residues of the vaccine and TLR5 are magnified in 20 Angstrom. Docked model was visualized by Discovery studio 4.5.
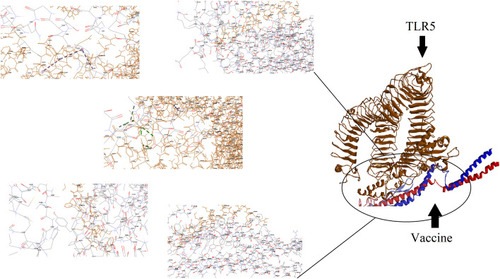
Figure 4 Docking model (cartoon representation) of human TLR8 in complex with the vaccine obtained using Cluspro server. TLR8 protein is shown in chocolate and vaccine was colored from N-to C-terminals (N-flagellin is shown in blue and C-flagellin is shown in red. As the figure shows some parts of S, M, N, and E epitopes, HBD-3 and HP-91 interacted with TLR8). In order to more visualized interaction points, some of the interacting residues of the vaccine and TLR8 are magnified in 20 Angstrom. Docked model was visualized using Discovery studio 4.5.
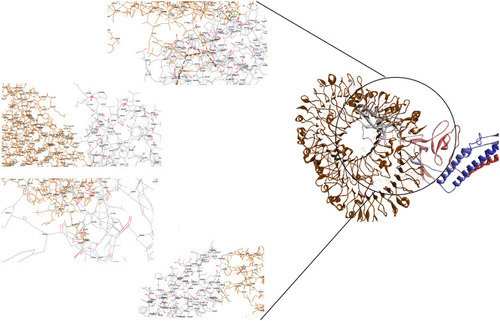
Figure 5 Docking model (cartoon representation) of human ACE-2 in complex with the vaccine obtained using Cluspro server. ACE-2 protein is shown in chocolate and vaccine was shown in purple. As the figure shows RBD epitopes of vaccine interacted with ACE-2. In order to more visualized interaction points, some of the interacting residues of the vaccine and ACE-2 are magnified in 20 Angstrom. Docked model was visualized using Discovery studio 4.5.
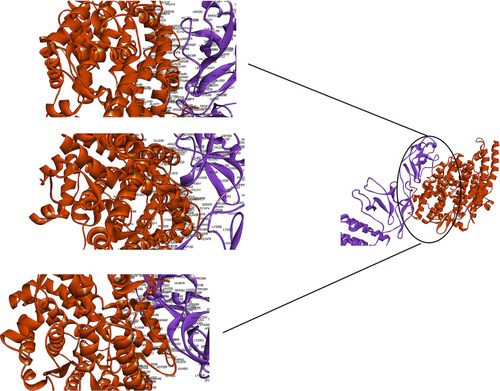
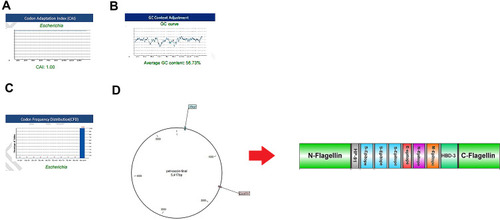
Figure 6 Evaluation of the three important parameters of the codon-optimized gene to express high-level protein in E. coli. (A) CAI of the gene sequence was 1. It is noted that a CAI of > 0.8 will be considered as good for expression in the selected host. (B) Average GC content of the sequence was 58.73%. (C) Codon frequency distribution (CFD) value of the gene sequence is 100. A CFD equal to100 supports maximum protein expression in the desired host. (D) Insertion of the vaccine gene in the PET28 vector by restriction enzymes of NcoI and XhoI.