Figures & data
Table 1 Antibiotic Resistance of Isolated Gram-Negative Bacteria from 2017 to 2019
Figure 1 Three years evaluation of MDR of isolated gram-negative bacteria. Results were presented as percentage ±SD of MDR of isolated bacteria compared to their antibiotic resistance. Mixed-model analysis was performed for the multiple comparisons, and *Indicates a significant difference in multi-drug resistance between years (p < 0.05).
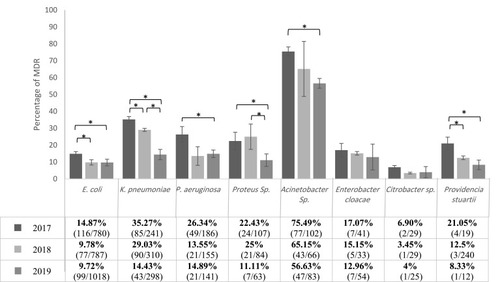
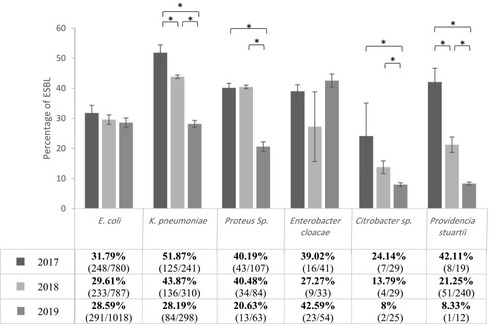
Figure 2 Three years evaluation of ESBL of isolated gram-negative bacteria. Results were presented as percentage ±SD of ESBL of isolated bacteria compared to their antibiotic resistance strain. Mixed-model analysis was performed for the multiple comparisons, and *Indicates a significant difference in ESBL between years (p < 0.05).