Figures & data
Figure 1 Time series displaying the prevalence and mortality cases of the COVID-19 in the USA, the UK, Russia, and India. (A) The total confirmed cases in the USA, the UK, Russia, and India. (B) The total deaths in the USA, the UK, Russia, and India. (C) The daily incidents in the USA, the UK, Russia, and India. (D) The total new deaths in the USA, the UK, Russia, and India. Note, there were some data that were displayed as negative values in the “new cases” or incidents owing to the recent trend of countries performing data reconciliations, some cases or deaths were thus removed from the total notifications. So the total confirmed cases and the total deaths were retrospectively updated based on the additional details available provided by WHO when we constructed the ARIMA and ETS models, in order to obtain accurate and reliable forecasts for the coming days.
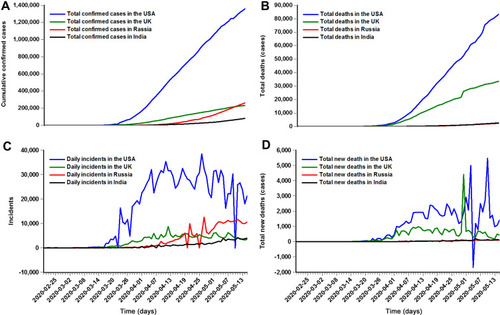
Table 1 The 30 Possible ETS Models in Relation to Different Combinations of Trend, Seasonality and Residual
Table 2 Estimated Parameters of the Best-Fitting ARIMA Methods and Their Goodness of Fit Test Results for the Prevalence and Mortality of COVID-19 in These Four Countries
Figure 2 Estimated autocorrelation function (ACF) and partial ACF (PACF) plots to forecast the epidemic trends of the COVID-19 prevalence for (A) USA, (B) UK, (C) Russia, and (D) India. It can be seen that almost all the correlation coefficients fall into the estimated 95% uncertainty interval apart from that in Russia, suggesting that the identified ARIMA methods seem to be suitable for modeling the prevalence data in the study regions.
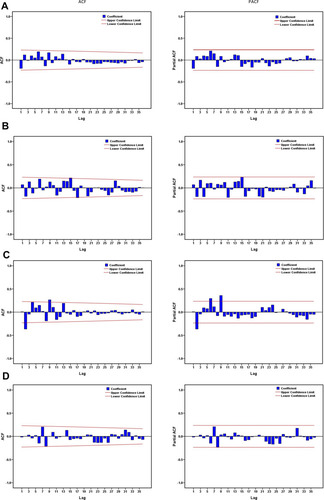
Figure 3 Estimated autocorrelation function (ACF) and partial ACF (PACF) plots to forecast the epidemic trends of the COVID-19 mortality cases for (A) USA, (B) UK, (C) Russia, and (D) India. It can be seen that almost all the correlation coefficients fall into the estimated 95% uncertainty interval apart from that in Russia, suggesting that the identified ARIMA methods seem to be suitable for modeling the mortality data in the study regions.
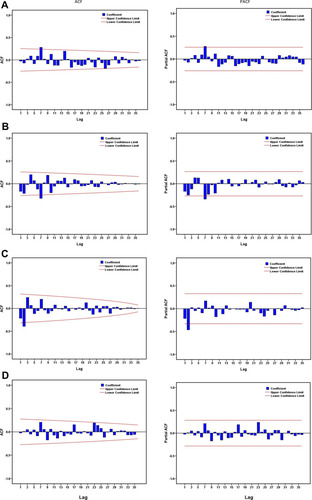
Table 3 Estimated Parameters of the Best-Fitting ETS Methods and Their Goodness of Fit Test Results for the Prevalence and Mortality of COVID-19 in These Four Countries
Table 4 Comparisons of Predictive Performances for the Prevalence and Mortality of COVID-19 Between the Best-Fitting ETS and ARIMA Models in These Four Countries
Table 5 Projection of the COVID-19 Prevalence into the Next 16 Days Using the ETS Models Based on the Entire Data
Table 6 Projection of the COVID-19 Mortality Cases into the Next 16 Days Using the ETS Models Based on the Entire Data
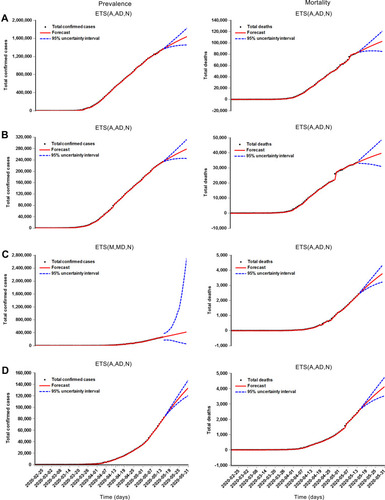
Figure 4 Time series plots showing the projections and their 95% uncertainty intervals of the prevalence and mortality of the COVID-19 for (A) USA, (B) UK, (C) Russia, and (D) India, between 16 May 2020 and 31 May 2020 using the ETS models constructed with the data between 20 February 2020 and 15 May 2020.