Figures & data
Table 1 Shows the Patients and Healthy Controls Clinical Characteristics
Table 2 Shows Strong Activation of MoDCs by HBVsvp in vitro, Which Expressed High Levels of CD86 and HLA-DR Than Negative Control. The MoDCs Activation Was Significantly (p < 0.001) Increased in Healthy Donors and Chronic Patients Comparing with the Negative Control for the Expression Levels of CD86 and HLA-DR Activation Markers
Figure 1 Showed FACS analysis of MoDCs, identified by expression of CD11c after 7 days of maturation, approximately 79.5% of the cultured cells were positive for CD11c, indicating the differentiation of monocytes towards MoDCs.
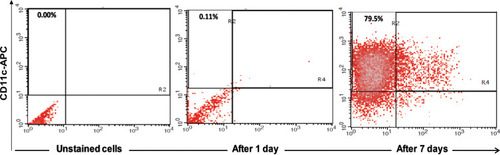
Figure 2 Showed CD86-PE activating marker of MoDCs detected in healthy donors and chronic patient groups at different treatment. Small letters represent the significance between normal control and chronic patient within each treatment. Capital letters represent the significance of normal control or chronic patient at different treatments. Error bars represent standard error (SE).
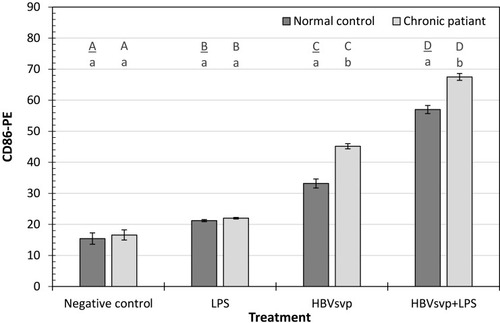
Figure 3 Showed HLA DR-PE activating marker of MoDCs detected in healthy donors and chronic patient groups at different treatment. Small letters represent the significance between normal control and chronic patient within each treatment. Capital letters represent the significance of normal control or chronic patient at different treatments. Error bars represent standard error (SE).
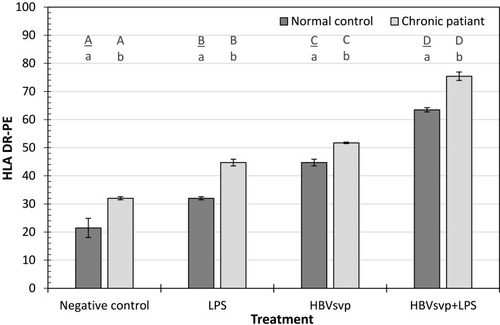
Figure 4 Showed MoDCs from healthy donors and chronic patients were secreted significantly larger amounts of the effector cytokine IL-4 into the culture medium when co-cultured with HBVsvp+ LPS. Capital letters represent the statistical significance difference between normal control and chronic patient at different treatments and/or within each treatment. Error bars represent standard error (SE).
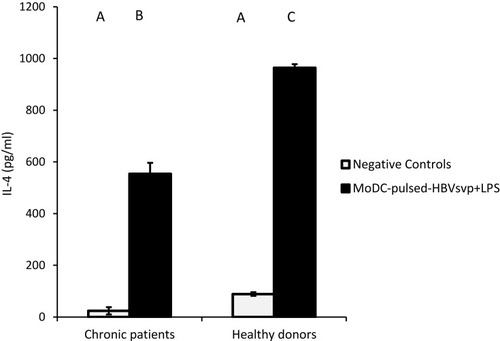
Figure 5 Showed MoDCs from healthy donors and chronic patients were secreted significantly larger amounts of the effector cytokine IL-12 into the culture medium when co-cultured with HBVsvp+ LPS. Capital letters represent the statistical significance difference between normal control and chronic patient at different treatments and/or within each treatment. Error bars represent standard error (SE).
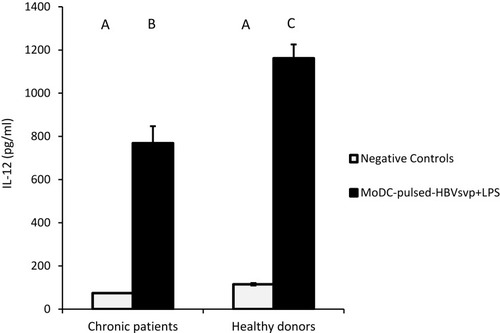
Figure 6 Showed ability of MoDCs-pulsed-HBVsvp to induce an autologous Th1/Tc polarization response in vitro for both healthy donors and chronic patients.
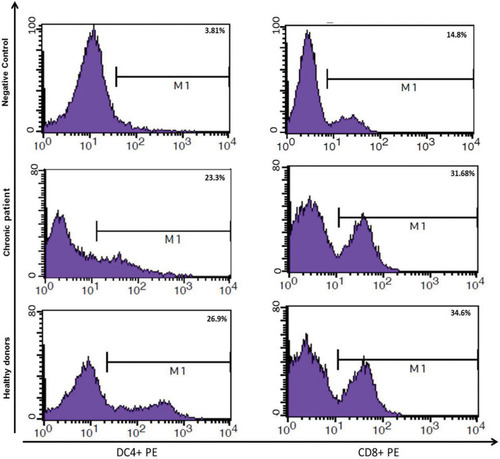
Figure 7 Showed HBV-specific-CTL from healthy donors and chronic patients were secreted significantly larger amounts of the effector cytokine IFN-γ into the culture medium when co-cultured with MoDCs-pulsed-HBVsvp. Capital letters represent the statistical significance difference between normal control and chronic patient at different treatments and/or within each treatment. Error bars represent standard error (SE).
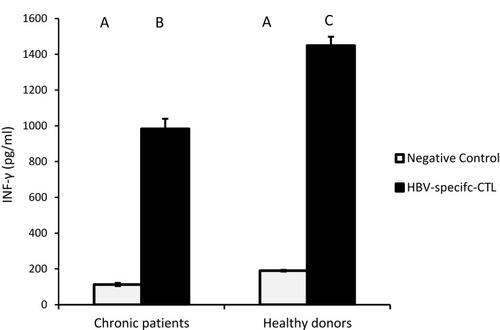
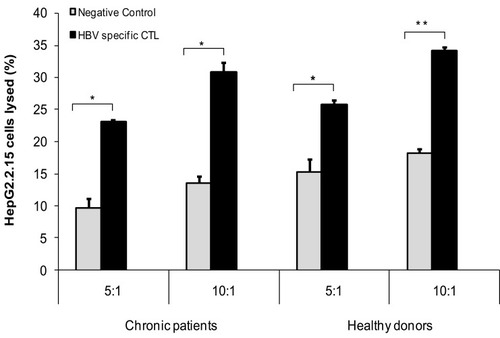
Figure 8 Showed the cytotoxicity assay for HBV-specific-CTL against HepG2.2.15 cell line in different ratio for different chronic patients and different healthy donors (**p < 0.001, *p < 0.05).