Figures & data
Table 1 Gradient Elution Program of Mobile Phase
Table 2 The Analytical Conditions for the LC-MS/MS Analysis of Gentamicin C1, C1a, C2, and Kanamycin
Figure 1 Plumbagin potentiates antibacterial activity of gentamicin against CRKp. (A) Susceptibility test to imipenem of antibiotics-susceptible strain of Klebsiella pneumoniae CCTCC AB 2010163 (left) and CRKp strain ATCC BAA-1705 (right) on LB agar plates. (B) Susceptibility test to gentamicin of ATCC BAA-1705 (left) and its induced gentamicin-resistant strain (right) on LB agar plates. (C) Heatmap profile of synergistic effect of herbal compounds with gentamicin. Red, no synergistic effect; green, low synergistic effect; and purplish red, high synergistic effect. (D) The inhibition of combination treatments against the CRKp. (E) The inhibition of combination treatments against antibiotics-susceptible strain of Klebsiella pneumoniae. (F) Growth curves of CRKp with different treatments. *P<0.05, **P<0.01, ***P<0.001, and ****P<0.0001 compared with gentamicin monotherapy.
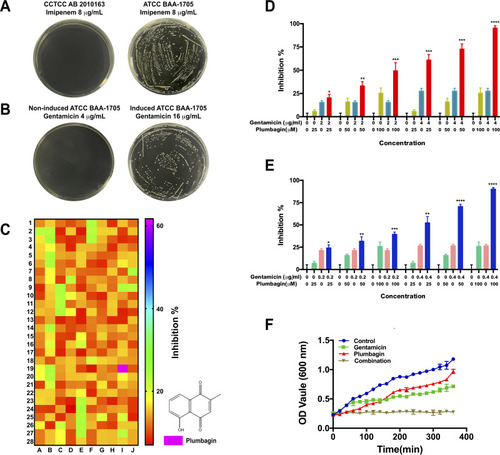
Figure 2 Effects of plumbagin on gentamicin uptake and membrane potential of CRKp. (A) LC-MS/MS chromatograms for gentamicin C-complex and internal standard kanamycin in CRKp. (B) Relative amount of intracellular gentamicin isoforms of gentamicin monotherapy (gentamicin 16 μg/mL) and combination therapy (plumbagin 100 μM and gentamicin 16 μg/mL). (C) Analysis of membrane potential using red and green fluorescence parameters. Blue, untreated control group. Red, plumbagin-treated group. (D) Quantification of membrane potential. Red/green ratios were calculated using population mean intensities of the CRKp incubated in the presence or absence of plumbagin. Results are displayed as mean±SEM. *P<0.05, **P<0.01.
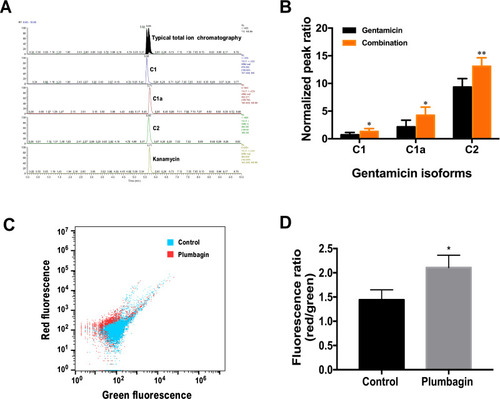
Figure 3 Effects of plumbagin on TCA efflux and NADH production. (A) TIC of intracellular metabolites in CRKp. (B) PCA score plots of intracellular metabolites in the CRKp with or without plumbagin treatment. Red, untreated control; green, plumbagin treated. (C) Clustered heatmap profiles of the relative abundance for significantly affected metabolites in CRKp treated with plumbagin. The colors indicate the relative abundance of significantly affected metabolites after plumbagin treatment. Blue, significantly decreased; red, significantly increased. Significant metabolites were selected based on P<0.05 and FC≧1.2 (one-way ANOVA). (D) Relative intensity of malate in CRKp. (E) Relative intensity of α-ketoglutarate in CRKp. (F) Measurement of intracellular NADH concentration. Results are displayed as mean±SEM. **P<0.01, ***P<0.001.
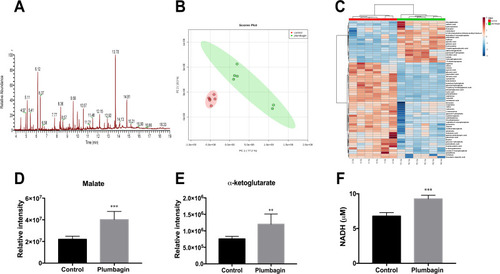
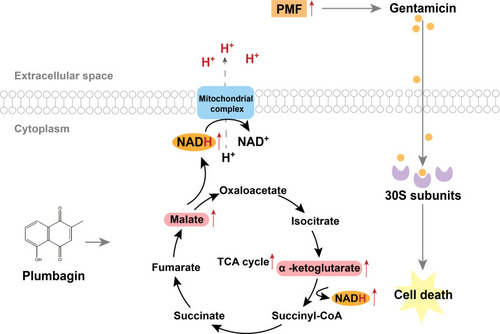
Figure 4 Proposed model for antibacterial mechanism of plumbagin. Plumbagin increased NADH production from malate and α-ketoglutarate in the TCA cycle, thereby increasing PMF and stimulating bacterial uptake of gentamicin to potentiate its bactericidal effect.