Figures & data
Figure 1 Egypt’s map displaying the location of the Qena governorate, and the red box shows the site of four studied localities in Qena where the participants live (Alhujyrat, Altramsa, Dandara, and Qena).
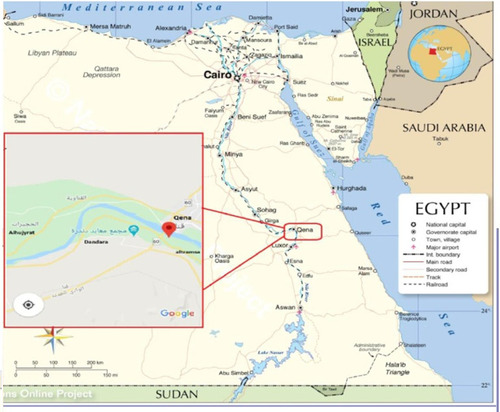
Table 1 No. of the Included Participants in the Study and Their Distribution
Table 2 Criteria of Patients Gave Positive RAPD –PCR Results
Table 3 RAPD Polymorphism Among Human Schistosoma haematobium Isolates
Figure 2 RAPD-PCR patterns produced from the genomic DNA of Schistosoma haematobium isolated from 20 infected patients generated by four oligoprimers. (A) Positive control. (B) Negative control. (C) DNA Pattern generated with Primer A02. (D) DNA Pattern generated with Primer A07. (E) DNA Pattern generated with Primer A09. (F) DNA pattern with Primer A10. Bands were visualized by 1.2% agarose gel electrophoresis stained with ethidium bromide.
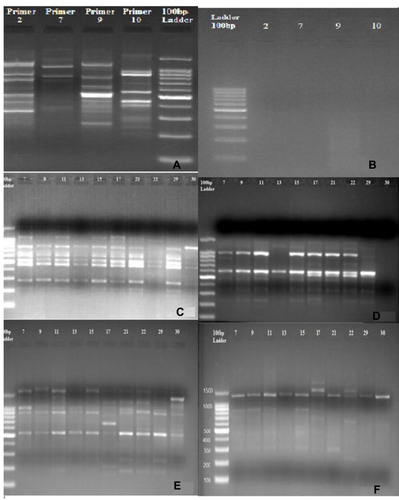
Table 4 Genetic Similarity Coefficient Among Human S. haematobium Isolates Showing Dissimilarities Between Isolates
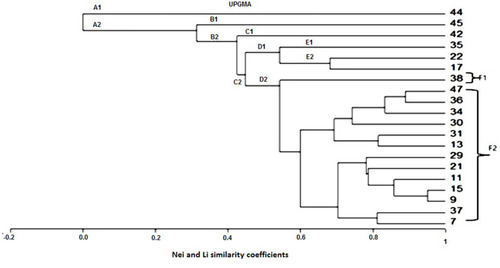
Figure 3 Dendrogram (UPGMA) based on Nei and Li similarity coefficient.