
Figures & data
Figure 1 Screening algorithm of patients hospitalized with RVs-p.
Notes: A total of 4150 patients with nucleic acids positive for respiratory viruses were screened, and 1420 eligible patients with respiratory viruses-related pneumonia were included in the study.
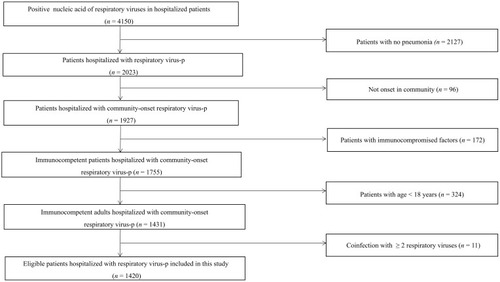
Table 1 Comparison of Clinical and Radiologic Features Between Patients with Flu-p and NIRVs-p
Table 2 Comparison of Clinical Management and Outcomes Between Patients with Flu-p and NIRVs-p
Figure 2 Forest plot of predictors for Flu-p.
Notes: Malgia and lymphocytes <0.8×10⁹/L were positively associated with Flu-p; while COPD, solid malignant tumor and blood albumin <35 g/L were positively associated with NIRVs-p.
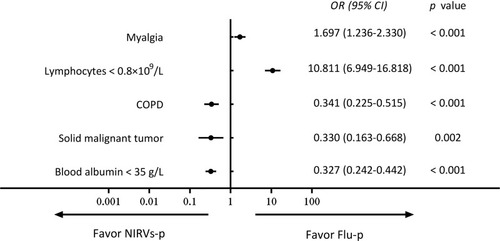
Table 3 Impact of Viruses Types on Clinical Outcomes of Patients with RVs-p
Table 4 Risk Factors for 30-Day Mortality in Patients with RVs-p