Figures & data
Table 1 Variables and Levels Used in RSM Central Composite Design for Optimization of Antifungal Production
Table 2 Central Composite Design Runs for the 5 Different Factors Tested Showing the Observed and Predicted Responses
Figure 1 Standard calibration curve of terbinafine concentration versus inhibition zones obtained against Candida albicans ATCC 10231.
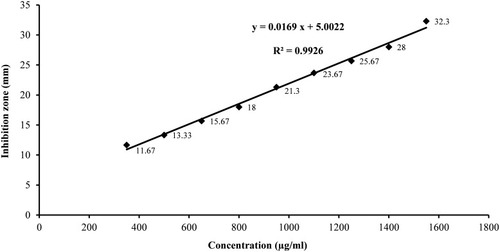
Figure 2 Time course of antifungal production by Lysinibacillus isolate MK212927 in basal media. The presented data are the means of three readings while the vertical small error bars indicate the standard deviation of the data.
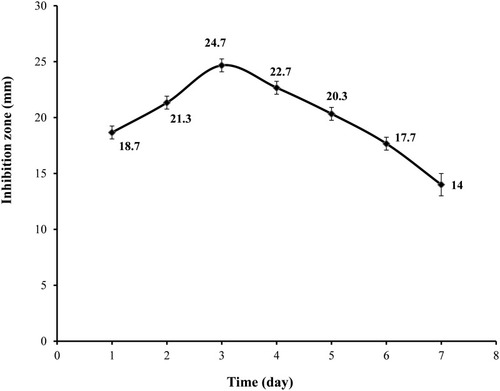
Figure 3 Effect of (A) different Carbon sources and (B) Nitrogen sources on the antifungal activity of Lysinibacillus isolate MK212927 against Candida albicans ATCC 10231.
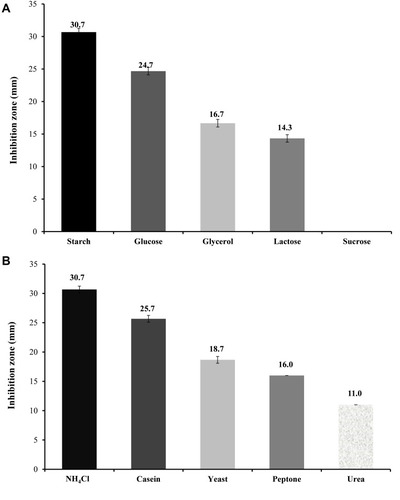
Table 3 The Analysis of Variance (ANOVA) of the Central Composite Design (CCD) Model for the Effects of Starch (A), Ammonium Chloride (B), pH (C) Temperature (D) and Agitation (E) on the Inhibition Zones Caused by the Antifungal Metabolite
Figure 4 Three-dimensional response surfaces representing the effect of the five significant parameters on inhibition zone obtained by the metabolite of Lysinibacillus isolate MK212927. When the effect of two parameters was plotted, the remaining ones were set at central level (A) starch and pH (B) starch and temperature (C) NH4Cl and agitation.
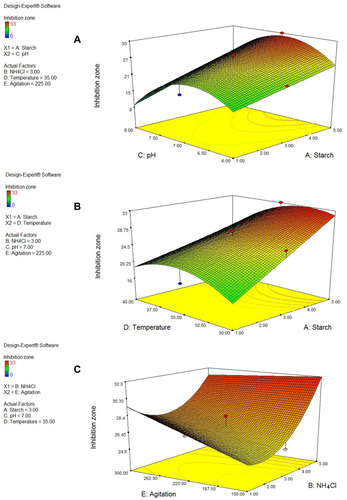
Figure 5 Contour plots representing the effect of the five significant parameters on inhibition zone obtained by the metabolite of Lysinibacillus isolate MK212927. When the effect of two parameters was plotted, the remaining ones were set at central level (A) starch and pH (B) starch and temperature (C) NH4Cl and agitation.
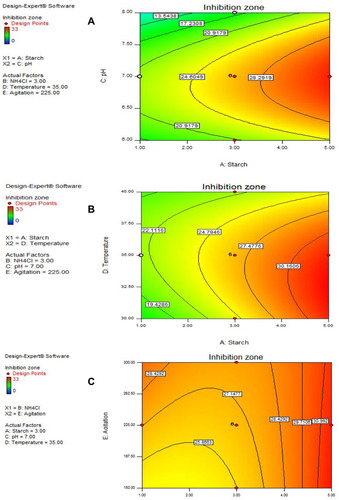
Figure 6 Model diagnostic plots. (A) The normal probability plot of residuals, (B) Box Cox plot, (C) Predicted versus actual values plot and (D) Residuals versus Run number plot.
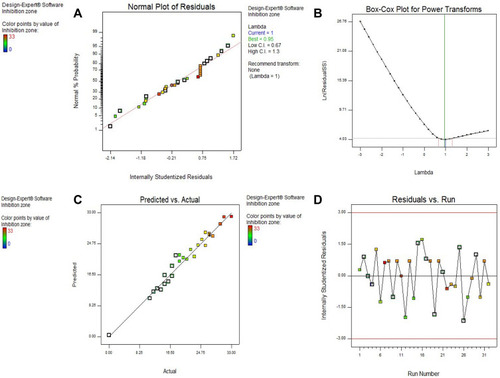
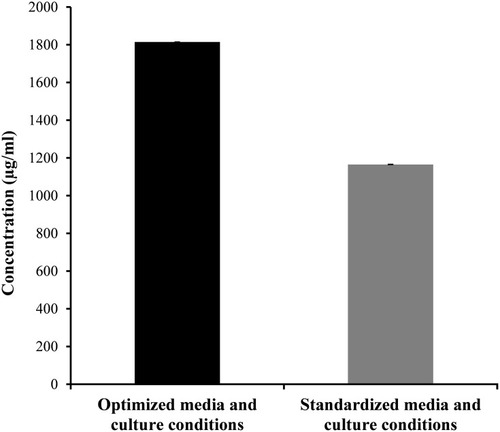
Figure 7 Comparison of antifungal production by Lysinibacillus isolate MK212927 using optimized and standardized conditions.